Google Search Console tells you how many clicks, impressions, and ranking positions a page receives. Your content monitoring tool tells you when the title, H1, or canonical changed. But these two data streams live in separate products — which means you can see a click drop without knowing what caused it, and you can publish a title rewrite without knowing whether it moved the needle. 2-UA's Search Console integration overlays both on the same timeline, both for the whole site and for each tracked URL.
What is imported from Google Search Console
Once connected, 2-UA imports the following daily per-URL metrics from Google Search Console's Search Analytics API:
- Clicks — how many times a user clicked your result in Google Search
- Impressions — how many times your page appeared in search results
- CTR — click-through rate (clicks ÷ impressions)
- Average Position — mean ranking position across all queries where the page appeared
Data is imported every night for the previous day. The import covers all tracked URLs — no need to configure each page separately. One connection per site covers the entire site.
Two chart levels: site-wide and per URL
2-UA shows Search Console performance at two levels so you can move from a broad traffic signal to the exact URL that changed:
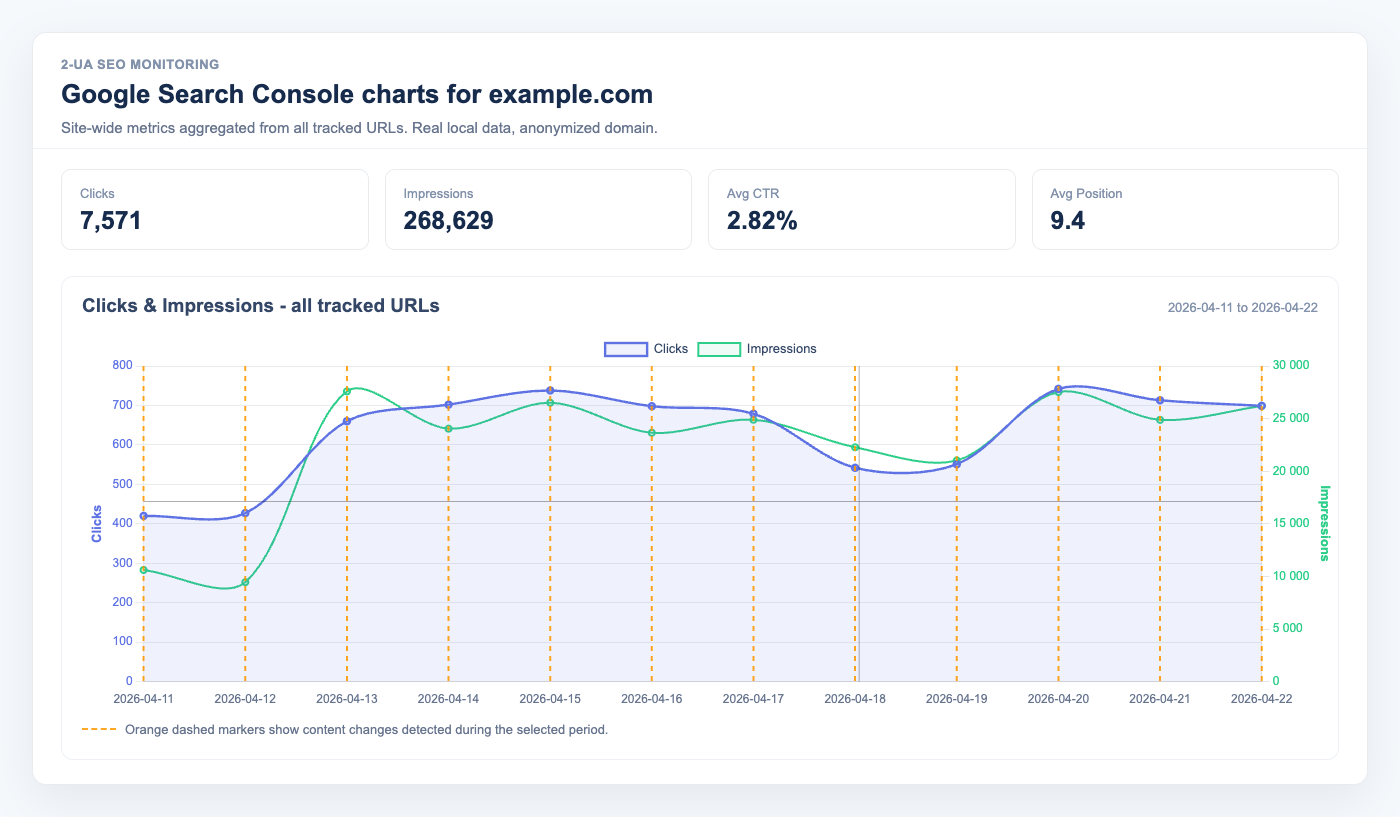
- Site → Search Console shows the whole tracked site: summary cards, site-wide trends, and the top pages table.
- URL → Quick menu → Search Console shows the same metrics for one tracked URL, with that URL's own content-change markers.
The site-wide view is useful for spotting broad changes: a crawl template update, site-wide title pattern change, indexing shift, or deploy that affected many pages. The URL view is better for debugging one page: title rewrites, H1 edits, canonical changes, redirects, or page-specific content updates.
How to read the GSC charts
Both the site-wide and per-URL Search Console pages include two charts:
- Clicks & Impressions — clicks use the left axis, impressions use the right axis. This keeps clicks readable even when impressions are much larger.
- CTR & average position — CTR uses a percentage axis, and average position is inverted so higher movement means better rankings.
The chart cursor draws a vertical and horizontal guide line, similar to a response-time monitoring chart. This makes it easier to compare the selected date with both axes at once, especially when clicks and impressions use different scales.
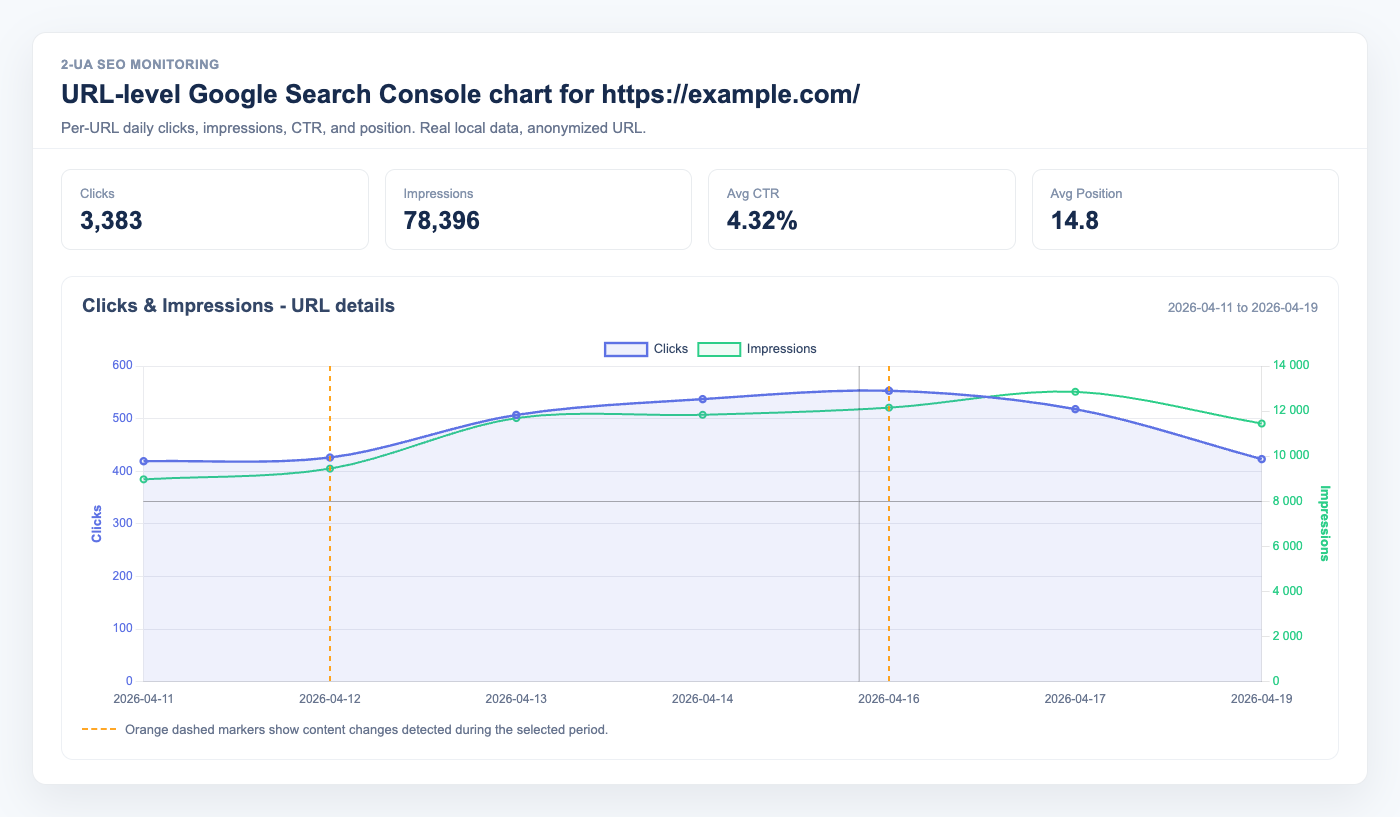
Orange vertical markers show dates when 2-UA detected content changes. If there are only a few change dates, the chart labels them as Content change. If there are many change dates, labels are hidden and only the vertical markers remain, so the chart stays readable.
How site-wide metrics are calculated
On the site-wide Search Console page, daily clicks and impressions are summed across tracked URLs.
CTR is calculated as total clicks ÷ total impressions, not as a simple average of page CTR values.
Average position is weighted by impressions, which makes the site-level line closer to how Search Console reports performance for a property.
This distinction matters. A page with 10 impressions should not influence the site-wide position as much as a page with 10,000 impressions. Weighting by impressions keeps the chart useful for real SEO decisions instead of letting low-volume URLs distort the trend.
Content changes as timeline events
Every time 2-UA detects a content change on a tracked URL — a different title, a new canonical tag, a changed H1 — it records that event. On the Search Console chart, those events appear as vertical markers. You see exactly where on the clicks and CTR curve the change happened.
Example scenarios this makes visible:
- You rewrote the title on 3 March. Clicks jumped 40% in the following week. The marker confirms the timing.
- A CMS update silently removed the H1 on 12 April. Impressions fell sharply the next day. The marker identifies the cause.
- A redirect was changed, and the canonical tag shifted. Position dropped. The marker ties it to the deploy.
How to connect
- Open any tracked URL → Quick menu → Search Console.
- Click Connect Google Search Console.
- Sign in with a Google account that has Owner or Full User permission for the site in GSC.
- Approve access. 2-UA stores only an offline refresh token — it never reads your emails or any data outside Search Console.
- Data appears the next morning after the nightly import.
You can also navigate to Site → Search Console to see site-wide charts and a top-pages table ranked by total clicks.
Position chart and why it is inverted
The average position chart uses an inverted Y-axis: position 1 (top of search results) is at the top of the chart, and position 50 is at the bottom. This matches the visual intuition — rising lines mean better rankings. This applies on both site-wide charts and per-URL charts.
Who should use this
- SEO teams doing CRO or title experiments — correlate rewrite dates with CTR changes.
- Developers who want to verify that a deploy did not break any search metrics.
- Content managers who update pages frequently and want to see whether updates improved or hurt traffic.
- Agency SEOs building client reports — the chart answers "what changed and what happened to traffic" without cross-referencing three tools.
Privacy and access scope
The OAuth scope requested is webmasters.readonly.
2-UA reads only Search Analytics data for your verified properties.
The refresh token is stored encrypted in the database and is used exclusively for daily data imports.
You can disconnect at any time — the stored token is immediately deleted and imports stop.
Stop losing SEO performance to silent changes
If this workflow matches your current SEO bottleneck, do not postpone implementation. Teams usually lose the most traffic between detection and action, not between action and resolution. Start monitoring today and create your first baseline in under an hour.
Execution blueprint for google search console seo monitoring
Long-form SEO implementation fails when teams try to “fix everything” at once. The sustainable approach is to define a narrow execution lane, prove measurable movement, and scale based on validated impact. For monitoring workflows, this usually means setting explicit ownership, reporting cadence, and escalation thresholds.
A useful way to operationalize this is to split work into three layers: detection, validation, and rollout. Detection finds anomalies quickly. Validation confirms whether the anomaly is material or incidental. Rollout converts validated findings into engineering and content tasks with deadlines. If one layer is missing, the process becomes either noisy or slow.
90-day rollout plan
Days 1-14: baseline and instrumentation
- Define the monitored scope: templates, critical URLs, and ownership groups.
- Set expected behavior for status codes, redirects, and indexation-relevant rules.
- Enable alerts in your team channel and set an initial noise-control policy.
- Run the first full crawl and preserve it as a technical baseline snapshot.
- Document the current known issues so future alerts can be triaged faster.
Days 15-45: controlled improvement
- Move from URL-level fixes to issue-family fixes (template/system level).
- Review trends weekly for response time, quality checks, and crawl findings.
- Introduce tag-based segmentation if your team supports multiple page clusters.
- Track fix validation in re-crawls and keep a short evidence log for each change.
- Escalate only high-impact regressions to engineering to avoid context switching overload.
Days 46-90: scale and commercialization
- Standardize recurring reports for stakeholders and client-facing communication.
- Harden your alert policy with quieter thresholds and clear severity levels.
- Expand monitoring from critical templates to full coverage where justified.
- Turn recurring findings into preventive engineering tasks, not one-off tickets.
- Connect technical trend movement to revenue-adjacent metrics for executive buy-in.
Measurement model: what to track weekly
You should define a compact KPI stack that reflects both technical quality and operational speed. Over-measuring creates reporting overhead and weakens decision quality. A practical KPI model for this topic includes:
- Detection speed: time from change occurrence to first alert.
- Triage speed: time from alert to issue classification and owner assignment.
- Resolution speed: time from assignment to verified fix.
- Regression rate: how often a fixed issue class returns within 30 days.
- Coverage quality: share of critical pages included in active monitoring.
- Business relevance: proportion of high-impact issues in total issue volume.
For mature teams, the strongest KPI is not total issue count but high-impact issue recurrence. When recurrence falls, process quality is improving.
Stakeholder alignment framework
Technical SEO execution usually fails at the handoff boundary. SEO specialists detect issues, but engineering sees isolated tasks without business context. Fix this by sending implementation-ready summaries:
- What changed (objective signal, not interpretation).
- Where it changed (template, segment, or specific URL class).
- Why it matters (indexation, visibility, trust, conversion risk).
- What to do next (single recommended action with acceptance criteria).
- How to verify (which re-check confirms the fix).
If your company runs weekly planning, summarize this in one page before sprint grooming. If you run continuous delivery, post a compact incident card into Slack or ticketing with direct links.
Common failure patterns and how to avoid them
- Too much scope: teams monitor everything and fix nothing. Start with critical assets.
- No baseline: every alert feels urgent without a reference snapshot.
- Tool-only mindset: dashboards do not create outcomes without process ownership.
- One-channel reporting: executives and implementers need different output layers.
- No post-fix validation: “done” without re-check creates hidden regressions.
Operational checklist you can reuse
- Confirm scope and ownership for monitored entities.
- Establish expected behavior and escalation policy.
- Launch baseline checks and preserve initial state.
- Run weekly issue-family review with implementation owners.
- Validate completed fixes with scheduled re-checks.
- Report only high-signal movements to leadership.
- Iterate thresholds every 2-4 weeks based on false-positive rate.
Commercial impact: turning technical work into revenue protection
Teams buy monitoring platforms when they can prove one thing: technical signals reduce preventable loss and shorten recovery time. In practice, you can demonstrate this by documenting incidents prevented, recovery cycles reduced, and implementation throughput improved.
This is where aggressive execution beats passive auditing: instead of producing occasional reports, you build an operating system for technical SEO quality. Once that system is in place, scaling to more URLs, more sites, and more stakeholders becomes predictable.
Advanced FAQ for google search console seo monitoring
How much historical data is enough for reliable decisions?
For most SEO teams, 4 to 8 weeks of consistent monitoring is enough to separate random fluctuation from structural movement. If your release velocity is high, use shorter review cycles but keep a rolling 8-week reference window. The key is consistency: gaps in monitoring reduce interpretability more than imperfect metrics.
Should we optimize for issue count reduction or impact reduction?
Always optimize for impact reduction. Lower issue count can be misleading if high-severity classes remain unresolved. In mature workflows, teams track high-impact recurrence, time-to-resolution, and incident spread by template class.
What is the best cadence for reporting this topic to leadership?
Weekly operational review plus a monthly executive summary works best. Weekly reports should focus on changes, actions, and blockers. Monthly reports should focus on trend direction, prevented incidents, and business-risk reduction. This two-layer model avoids both over-reporting and under-reporting.
How do we keep collaboration smooth with engineering teams?
Convert every finding into an implementation-ready task: define affected scope, expected behavior, acceptance criteria, and verification method. Engineering teams respond faster when tasks are deterministic. Avoid sending raw issue exports without business context.
When should we escalate from soft monitoring to stricter controls?
Escalate when any of the following is true: critical template regressions appear repeatedly, recovery time is increasing, or ownership is unclear across incidents. At that point, tighten alert policy, enforce scope ownership, and add stricter verification gates after releases.
How do we evaluate ROI for this workflow?
ROI appears in three layers: lower incident duration, fewer recurring regressions, and improved implementation confidence across teams. For stakeholder communication, quantify prevented loss events and reduced recovery effort rather than raw technical counts. This framing translates technical monitoring into business language that supports budget decisions.