How to use CrUX field data
What is CrUX field data?
CrUX (Chrome User Experience Report) is Google's dataset of real performance measurements collected from millions of Chrome users. Unlike PageSpeed Insights lab scores — which run synthetic tests on a single machine — CrUX aggregates actual user sessions over a 28-day rolling window. Google uses CrUX data for its Core Web Vitals ranking signal, not lab scores.
Which metrics does CrUX report?
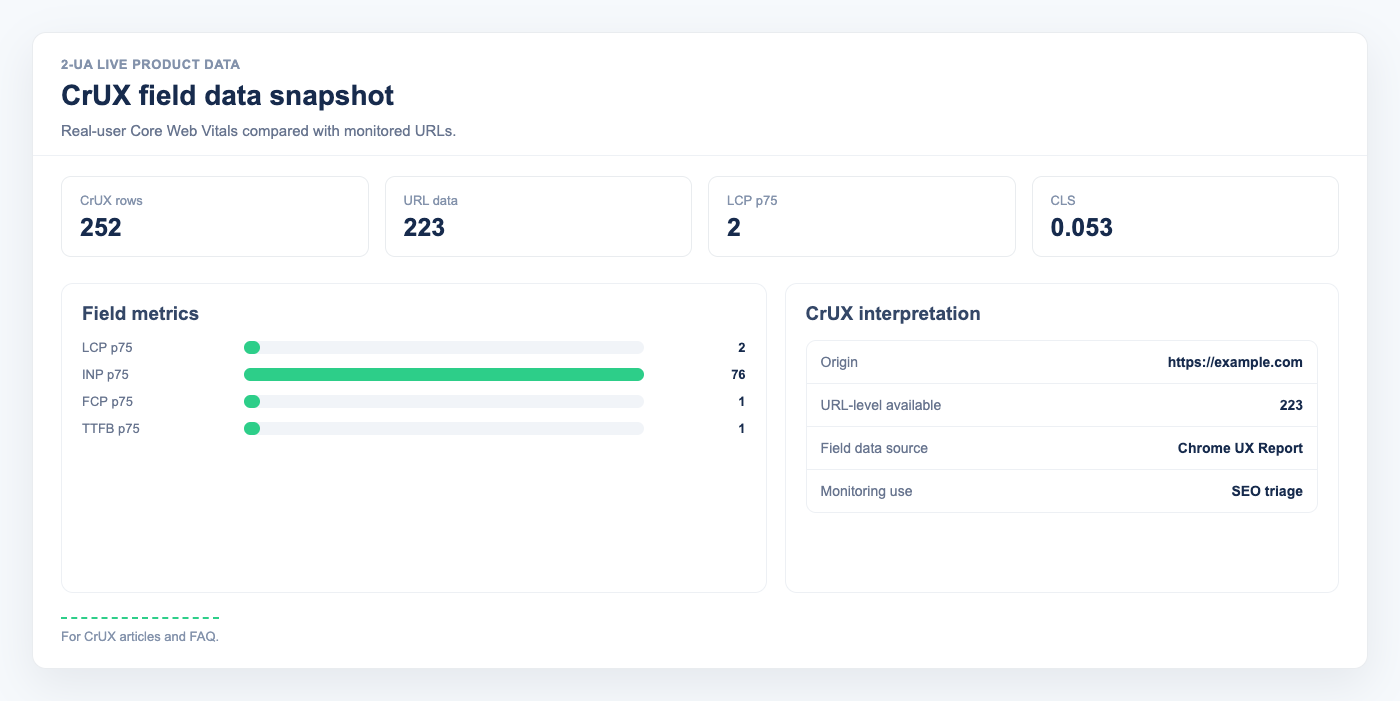
2-UA collects five Core Web Vitals metrics at the 75th percentile (p75):
- LCP — Largest Contentful Paint. Good: ≤ 2.5 s.
- CLS — Cumulative Layout Shift. Good: ≤ 0.10.
- FCP — First Contentful Paint. Good: ≤ 1.8 s.
- INP — Interaction to Next Paint. Good: ≤ 200 ms.
- TTFB — Time to First Byte. Good: ≤ 0.8 s.
All values are p75 — the value that 75 % of real user sessions are at or below. Colours follow Google's official thresholds: green (good), yellow (needs improvement), red (poor).
URL-level vs origin-level data
Google requires a minimum number of user sessions to publish data for a specific URL. Low-traffic pages often fall below this threshold and return no URL-level record. In that case, 2-UA automatically queries origin-level data (aggregated across your entire domain) and labels it Origin fallback so you know which source was used. Both URL-level and origin-level values are stored; you can compare them on the CrUX detail page.
Where to find CrUX data in 2-UA
There are two entry points:
- Per-URL: Open a tracked URL → Quick menu → CrUX field data. You will see colour-coded p75 values for both URL-level and origin-level data, plus the collection period reported by Google.
- Site-wide: Open the site overview → CrUX card. A table shows all desktop-tracked URLs with status 200 in one view, sorted by LCP descending so the slowest pages appear first.
How often is CrUX data refreshed?
2-UA queries the CrUX API v1 on each check cycle using the same Google API key as PageSpeed Insights. Google publishes a new 28-day dataset weekly, so daily changes in p75 values are normal and expected.
Why does my URL show "No data"?
A URL shows no data when neither URL-level nor origin-level data is available from Google. This can happen if the domain is new, has very low traffic, or is blocked from Chrome's telemetry. Building more organic or direct traffic to the URL will help accumulate the sessions needed for URL-level data to appear.