A Cloudflare bot management upgrade ships on Tuesday. By Friday your impressions in GSC start to soften. By the following week, your top-of-funnel queries are falling out of position 1–3 and you have no idea why. Cause: the WAF reclassified Googlebot as a bot worth rate-limiting and is now serving 403s on a meaningful share of requests. This article is the dedicated monitoring setup that turns a multi-week mystery into a same-day fix.
What this looks like before you notice in GSC
- Real users browse normally — no incident in monitoring tools that only check from your office IP.
- Googlebot crawl rate in GSC drops 30–80% within 24 hours of the WAF change.
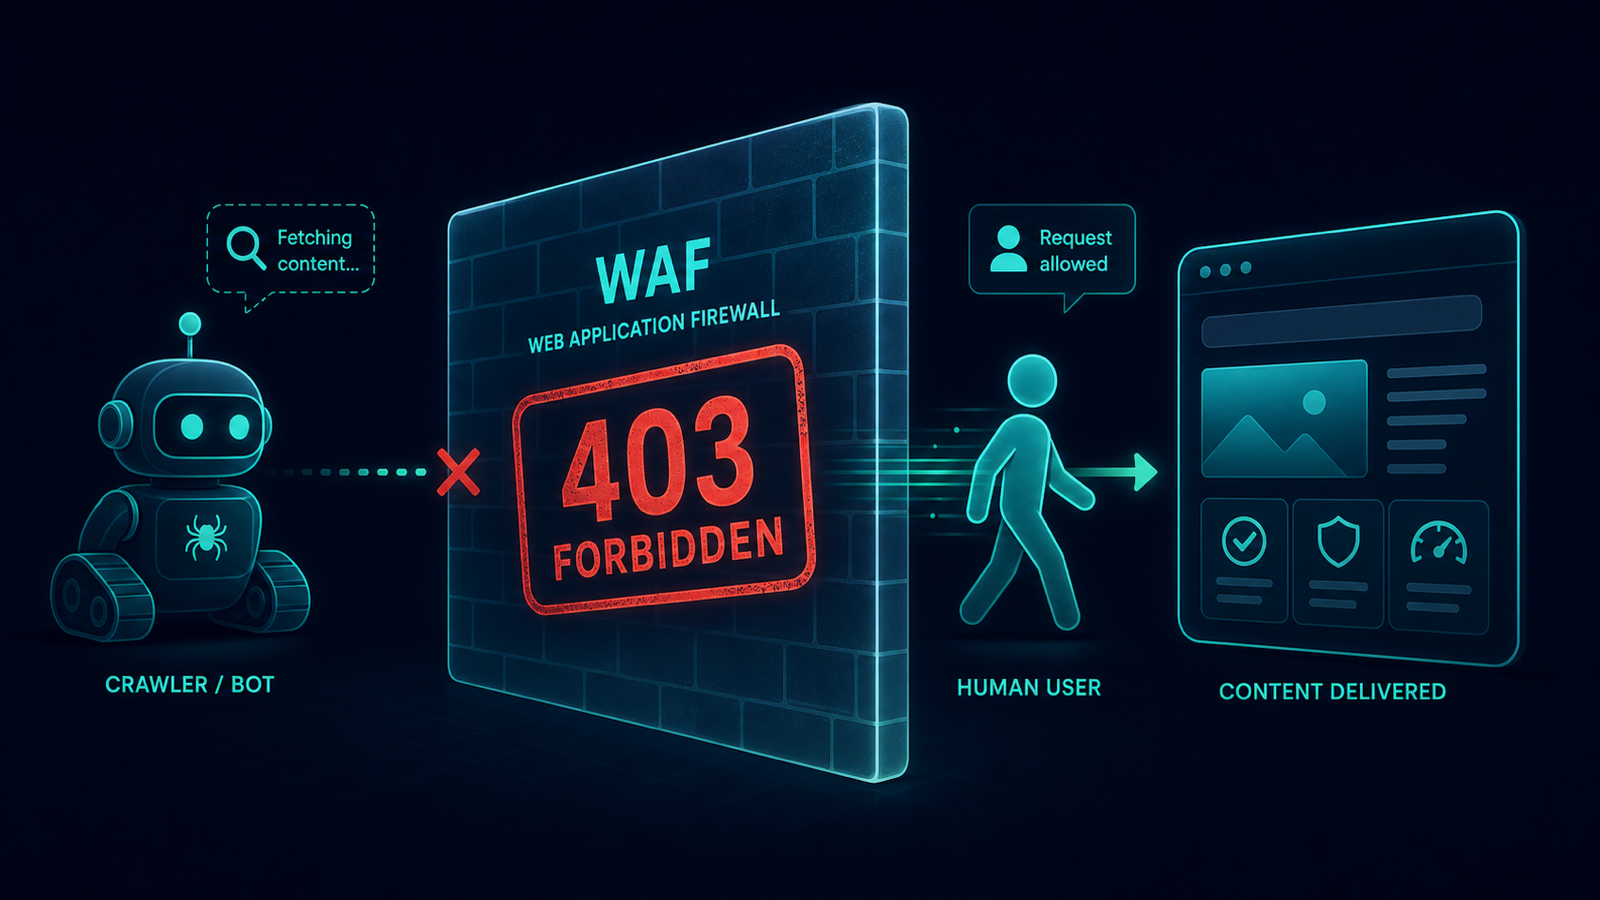
- A subset of URLs return 403 specifically to the Googlebot user-agent; the same URLs return 200 to other agents.
- Pages indexed but not recently recrawled go stale; ranking signals erode silently.
2-UA setup that catches this
- Create a crawl iteration with User-Agent: Googlebot Desktop and a small concurrency (2–4 threads — you are testing the WAF, not flooding it).
- Create a second iteration on the same URL set with a browser user agent.
- Compare status code distributions. A 403 gap between the two iterations on the same URLs is your smoking gun.
- Add the top 20 high-traffic URLs to Tracked URLs with Expected status: 200 and force the request user-agent to Googlebot. This is the recurring alert that catches the next WAF change.
- Confirm Site → GSC is connected so you can correlate crawl-status alerts with impressions decline on the same URLs.
The alert you wait for
The trigger is a tracked URL flipping from 200 to 403 (or 429) under the Googlebot user agent while the same URL returns 200 to other agents.
The 2-UA dashboard shows the status histogram and the response headers, so you can quickly identify the WAF signature
(cf-mitigated, x-akamai-grn, x-sucuri-id) that gates the response.
Ten-minute response playbook
- Confirm the 403 is from your WAF, not your origin (check the response headers and CDN logs).
- Pull the WAF event log filtered by the 2-UA crawl IPs and by
User-Agent contains "Googlebot". - Adopt the official Google verification: reverse DNS lookup on the source IP and forward DNS confirm to a
googlebot.comhostname. Allowlist by reverse DNS rule, not by IP list. - Re-run the Googlebot-UA crawl iteration to confirm 200s are restored across the URL set.
- Submit the affected URLs for recrawl via GSC → URL Inspection → Request Indexing to speed recovery.
Three configuration patterns that introduce silent Googlebot blocks
- Bot management rule with "challenge unknown bots" — Googlebot from new IP ranges occasionally trips this until the rule learns. Reverse-DNS allowlist is the only stable mitigation.
- Rate limiting per ASN — Googlebot's ASN aggregates many crawl IPs; per-ASN rate limits without bot-aware exceptions throttle real crawl traffic.
- JavaScript challenges on dynamic routes — Googlebot executes JS, but slowly; aggressive challenge timeouts produce intermittent 403s that come and go and look like phantom incidents.
Run an experiment from the free crawler with the Googlebot UA on twenty URLs of your site; if even one returns a 403 or 429, open a project for continuous monitoring across all critical templates.
Stop losing SEO performance to silent changes
If this workflow matches your current SEO bottleneck, do not postpone implementation. Teams usually lose the most traffic between detection and action, not between action and resolution. Start monitoring today and create your first baseline in under an hour.
Execution blueprint for googlebot 403 waf cdn block
Long-form SEO implementation fails when teams try to “fix everything” at once. The sustainable approach is to define a narrow execution lane, prove measurable movement, and scale based on validated impact. For crawling workflows, this usually means setting explicit ownership, reporting cadence, and escalation thresholds.
A useful way to operationalize this is to split work into three layers: detection, validation, and rollout. Detection finds anomalies quickly. Validation confirms whether the anomaly is material or incidental. Rollout converts validated findings into engineering and content tasks with deadlines. If one layer is missing, the process becomes either noisy or slow.
90-day rollout plan
Days 1-14: baseline and instrumentation
- Define the monitored scope: templates, critical URLs, and ownership groups.
- Set expected behavior for status codes, redirects, and indexation-relevant rules.
- Enable alerts in your team channel and set an initial noise-control policy.
- Run the first full crawl and preserve it as a technical baseline snapshot.
- Document the current known issues so future alerts can be triaged faster.
Days 15-45: controlled improvement
- Move from URL-level fixes to issue-family fixes (template/system level).
- Review trends weekly for response time, quality checks, and crawl findings.
- Introduce tag-based segmentation if your team supports multiple page clusters.
- Track fix validation in re-crawls and keep a short evidence log for each change.
- Escalate only high-impact regressions to engineering to avoid context switching overload.
Days 46-90: scale and commercialization
- Standardize recurring reports for stakeholders and client-facing communication.
- Harden your alert policy with quieter thresholds and clear severity levels.
- Expand monitoring from critical templates to full coverage where justified.
- Turn recurring findings into preventive engineering tasks, not one-off tickets.
- Connect technical trend movement to revenue-adjacent metrics for executive buy-in.
Measurement model: what to track weekly
You should define a compact KPI stack that reflects both technical quality and operational speed. Over-measuring creates reporting overhead and weakens decision quality. A practical KPI model for this topic includes:
- Detection speed: time from change occurrence to first alert.
- Triage speed: time from alert to issue classification and owner assignment.
- Resolution speed: time from assignment to verified fix.
- Regression rate: how often a fixed issue class returns within 30 days.
- Coverage quality: share of critical pages included in active monitoring.
- Business relevance: proportion of high-impact issues in total issue volume.
For mature teams, the strongest KPI is not total issue count but high-impact issue recurrence. When recurrence falls, process quality is improving.
Stakeholder alignment framework
Technical SEO execution usually fails at the handoff boundary. SEO specialists detect issues, but engineering sees isolated tasks without business context. Fix this by sending implementation-ready summaries:
- What changed (objective signal, not interpretation).
- Where it changed (template, segment, or specific URL class).
- Why it matters (indexation, visibility, trust, conversion risk).
- What to do next (single recommended action with acceptance criteria).
- How to verify (which re-check confirms the fix).
If your company runs weekly planning, summarize this in one page before sprint grooming. If you run continuous delivery, post a compact incident card into Slack or ticketing with direct links.
Common failure patterns and how to avoid them
- Too much scope: teams monitor everything and fix nothing. Start with critical assets.
- No baseline: every alert feels urgent without a reference snapshot.
- Tool-only mindset: dashboards do not create outcomes without process ownership.
- One-channel reporting: executives and implementers need different output layers.
- No post-fix validation: “done” without re-check creates hidden regressions.
Operational checklist you can reuse
- Confirm scope and ownership for monitored entities.
- Establish expected behavior and escalation policy.
- Launch baseline checks and preserve initial state.
- Run weekly issue-family review with implementation owners.
- Validate completed fixes with scheduled re-checks.
- Report only high-signal movements to leadership.
- Iterate thresholds every 2-4 weeks based on false-positive rate.
Commercial impact: turning technical work into revenue protection
Teams buy monitoring platforms when they can prove one thing: technical signals reduce preventable loss and shorten recovery time. In practice, you can demonstrate this by documenting incidents prevented, recovery cycles reduced, and implementation throughput improved.
This is where aggressive execution beats passive auditing: instead of producing occasional reports, you build an operating system for technical SEO quality. Once that system is in place, scaling to more URLs, more sites, and more stakeholders becomes predictable.
Advanced FAQ for googlebot 403 waf cdn block
How much historical data is enough for reliable decisions?
For most SEO teams, 4 to 8 weeks of consistent monitoring is enough to separate random fluctuation from structural movement. If your release velocity is high, use shorter review cycles but keep a rolling 8-week reference window. The key is consistency: gaps in monitoring reduce interpretability more than imperfect metrics.
Should we optimize for issue count reduction or impact reduction?
Always optimize for impact reduction. Lower issue count can be misleading if high-severity classes remain unresolved. In mature workflows, teams track high-impact recurrence, time-to-resolution, and incident spread by template class.
What is the best cadence for reporting this topic to leadership?
Weekly operational review plus a monthly executive summary works best. Weekly reports should focus on changes, actions, and blockers. Monthly reports should focus on trend direction, prevented incidents, and business-risk reduction. This two-layer model avoids both over-reporting and under-reporting.
How do we keep collaboration smooth with engineering teams?
Convert every finding into an implementation-ready task: define affected scope, expected behavior, acceptance criteria, and verification method. Engineering teams respond faster when tasks are deterministic. Avoid sending raw issue exports without business context.
When should we escalate from soft monitoring to stricter controls?
Escalate when any of the following is true: critical template regressions appear repeatedly, recovery time is increasing, or ownership is unclear across incidents. At that point, tighten alert policy, enforce scope ownership, and add stricter verification gates after releases.
How do we evaluate ROI for this workflow?
ROI appears in three layers: lower incident duration, fewer recurring regressions, and improved implementation confidence across teams. For stakeholder communication, quantify prevented loss events and reduced recovery effort rather than raw technical counts. This framing translates technical monitoring into business language that supports budget decisions.