Your frontend team upgrades Next.js from one major to the next on a Tuesday.
The app runs perfectly in QA — humans see all the content, every link works.
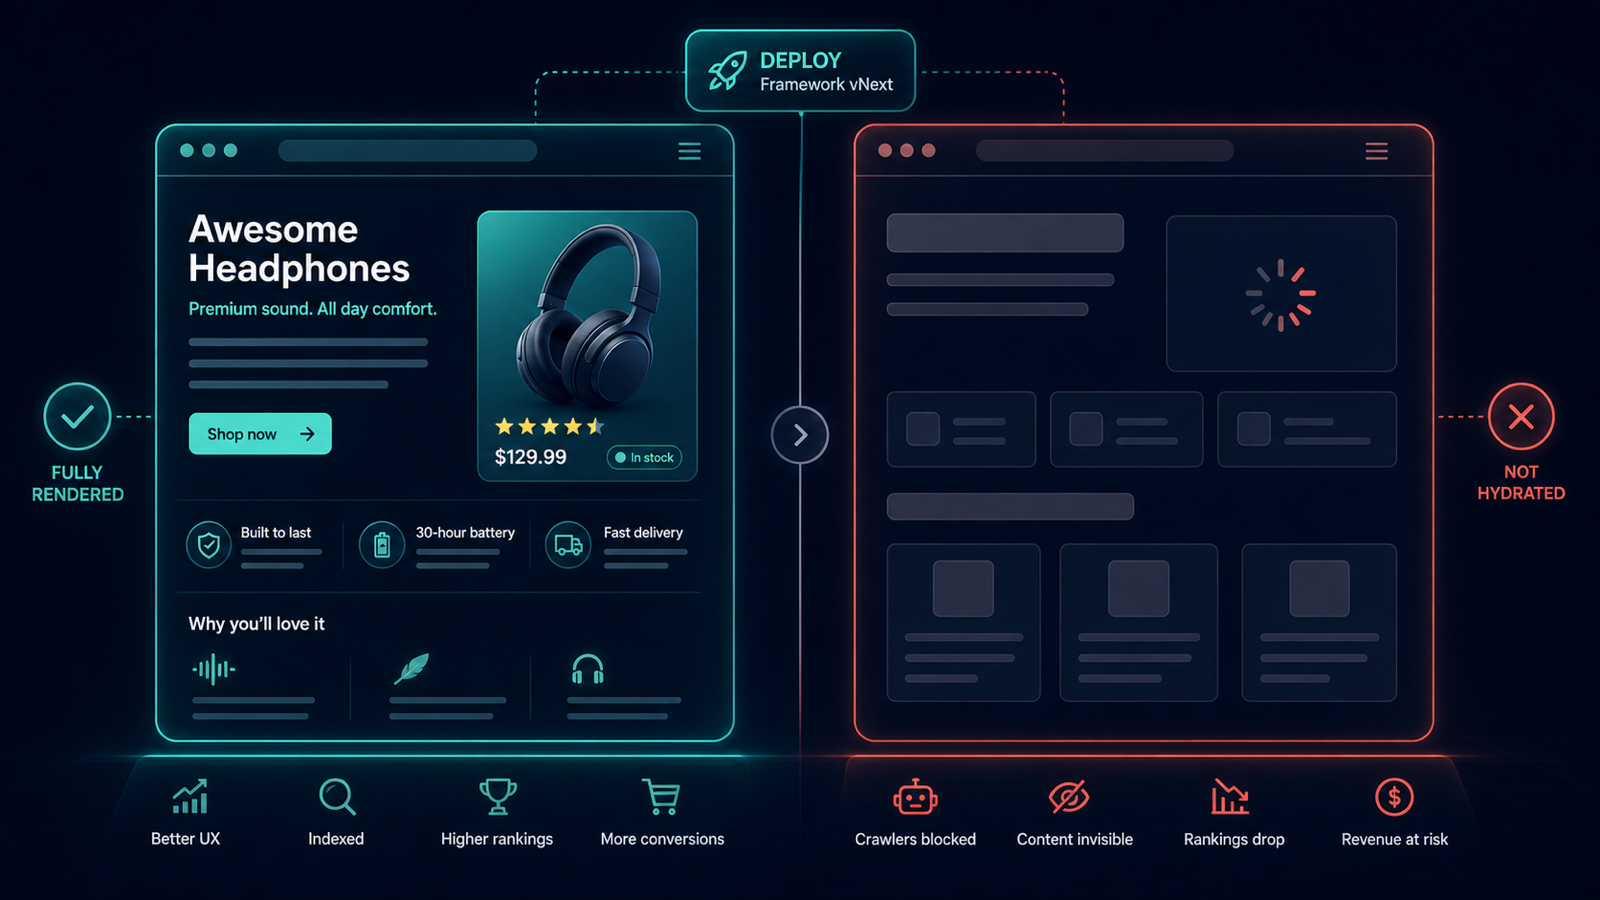
What the team did not notice is that the upgrade subtly changed hydration timing,
and the server-rendered HTML now ships an empty <main> block that gets filled only after JS executes.
To Googlebot's first-pass HTML crawler, every page is now a blank wrapper.
Two weeks later, organic traffic to product pages drops 40% and nobody can explain why.
This article is the parity-check setup that detects the regression on the day the upgrade lands.
What goes wrong in a JS upgrade
- Server-side rendering (SSR) breaks for a subset of routes; the HTML response no longer contains main content.
- Critical structured data moves from initial HTML to post-hydration injection; non-JS crawlers see no schema.
- Internal links rendered inside client-only components disappear from the crawlable link graph.
- Canonical tags or robots meta tags injected post-hydration are missed by HTML-first crawlers.
The parity-check setup in 2-UA
- Create two crawl iterations against the same URL list — one with Render JS: ON (browser-realistic), one with Render JS: OFF (HTML-first, the way a fast Googlebot pass sees the page).
- On both iterations, capture: response status, title, H1, meta description, canonical, robots meta, structured data, and total text length.
- Diff the two crawls. The columns that matter: text length JS off vs JS on, schema present off vs on, canonical present off vs on.
- Apply the filter:
text_length_no_js < 0.3 * text_length_with_js. Pages where the HTML-only render contains less than 30% of the hydrated content are at risk. - Add the top 20 commercially critical URLs to Tracked URLs with daily checks in both render modes. The next regression after the next upgrade fires the same alert.
The signal you wait for
A clean SSR site shows near-identical text length, identical schema presence, and identical canonical/robots metadata across the two render modes. A regression shows up as a sharp divergence on a specific template — usually one page class is broken while others render fine, because SSR configuration lives per-route.
Day-of response playbook
- Open the divergence report and identify which page class or template is affected.
- View the raw HTML response (without JS) directly in 2-UA's URL inspector. You will see exactly what content is missing.
- Check the relevant route's SSR or static-export configuration. In Next.js, this is typically
getServerSideProps,generateStaticParams, or the App Router's data-fetching layer. - Fix the SSR path or, if a quick rollback is feasible, revert the upgrade until the SSR regression is patched.
- Recrawl in JS-off mode to confirm the fix. The text-length parity ratio should return to near 1.0.
Three patterns that produce silent JS render breakage
- Client-only data fetching after upgrade — components that used to support SSR now require client-side hydration; Google can render JS, but takes longer to do so.
- Dynamic imports breaking initial paint — code-splitting boundaries shift; previously inlined content is now lazy-loaded out of the initial HTML.
- Authentication or feature-flag wrappers — a wrapper that gates content on a flag now defaults to "hide" in the absence of a hydrated user context, leaving an empty page to non-JS crawlers.
Run a quick parity check today with the free crawler on a handful of representative URLs, or set up dual JS-on / JS-off iterations inside a project for continuous parity monitoring.
Stop losing SEO performance to silent changes
If this workflow matches your current SEO bottleneck, do not postpone implementation. Teams usually lose the most traffic between detection and action, not between action and resolution. Start monitoring today and create your first baseline in under an hour.
Execution blueprint for js framework upgrade render break
Long-form SEO implementation fails when teams try to “fix everything” at once. The sustainable approach is to define a narrow execution lane, prove measurable movement, and scale based on validated impact. For crawling workflows, this usually means setting explicit ownership, reporting cadence, and escalation thresholds.
A useful way to operationalize this is to split work into three layers: detection, validation, and rollout. Detection finds anomalies quickly. Validation confirms whether the anomaly is material or incidental. Rollout converts validated findings into engineering and content tasks with deadlines. If one layer is missing, the process becomes either noisy or slow.
90-day rollout plan
Days 1-14: baseline and instrumentation
- Define the monitored scope: templates, critical URLs, and ownership groups.
- Set expected behavior for status codes, redirects, and indexation-relevant rules.
- Enable alerts in your team channel and set an initial noise-control policy.
- Run the first full crawl and preserve it as a technical baseline snapshot.
- Document the current known issues so future alerts can be triaged faster.
Days 15-45: controlled improvement
- Move from URL-level fixes to issue-family fixes (template/system level).
- Review trends weekly for response time, quality checks, and crawl findings.
- Introduce tag-based segmentation if your team supports multiple page clusters.
- Track fix validation in re-crawls and keep a short evidence log for each change.
- Escalate only high-impact regressions to engineering to avoid context switching overload.
Days 46-90: scale and commercialization
- Standardize recurring reports for stakeholders and client-facing communication.
- Harden your alert policy with quieter thresholds and clear severity levels.
- Expand monitoring from critical templates to full coverage where justified.
- Turn recurring findings into preventive engineering tasks, not one-off tickets.
- Connect technical trend movement to revenue-adjacent metrics for executive buy-in.
Measurement model: what to track weekly
You should define a compact KPI stack that reflects both technical quality and operational speed. Over-measuring creates reporting overhead and weakens decision quality. A practical KPI model for this topic includes:
- Detection speed: time from change occurrence to first alert.
- Triage speed: time from alert to issue classification and owner assignment.
- Resolution speed: time from assignment to verified fix.
- Regression rate: how often a fixed issue class returns within 30 days.
- Coverage quality: share of critical pages included in active monitoring.
- Business relevance: proportion of high-impact issues in total issue volume.
For mature teams, the strongest KPI is not total issue count but high-impact issue recurrence. When recurrence falls, process quality is improving.
Stakeholder alignment framework
Technical SEO execution usually fails at the handoff boundary. SEO specialists detect issues, but engineering sees isolated tasks without business context. Fix this by sending implementation-ready summaries:
- What changed (objective signal, not interpretation).
- Where it changed (template, segment, or specific URL class).
- Why it matters (indexation, visibility, trust, conversion risk).
- What to do next (single recommended action with acceptance criteria).
- How to verify (which re-check confirms the fix).
If your company runs weekly planning, summarize this in one page before sprint grooming. If you run continuous delivery, post a compact incident card into Slack or ticketing with direct links.
Common failure patterns and how to avoid them
- Too much scope: teams monitor everything and fix nothing. Start with critical assets.
- No baseline: every alert feels urgent without a reference snapshot.
- Tool-only mindset: dashboards do not create outcomes without process ownership.
- One-channel reporting: executives and implementers need different output layers.
- No post-fix validation: “done” without re-check creates hidden regressions.
Operational checklist you can reuse
- Confirm scope and ownership for monitored entities.
- Establish expected behavior and escalation policy.
- Launch baseline checks and preserve initial state.
- Run weekly issue-family review with implementation owners.
- Validate completed fixes with scheduled re-checks.
- Report only high-signal movements to leadership.
- Iterate thresholds every 2-4 weeks based on false-positive rate.
Commercial impact: turning technical work into revenue protection
Teams buy monitoring platforms when they can prove one thing: technical signals reduce preventable loss and shorten recovery time. In practice, you can demonstrate this by documenting incidents prevented, recovery cycles reduced, and implementation throughput improved.
This is where aggressive execution beats passive auditing: instead of producing occasional reports, you build an operating system for technical SEO quality. Once that system is in place, scaling to more URLs, more sites, and more stakeholders becomes predictable.
Advanced FAQ for js framework upgrade render break
How much historical data is enough for reliable decisions?
For most SEO teams, 4 to 8 weeks of consistent monitoring is enough to separate random fluctuation from structural movement. If your release velocity is high, use shorter review cycles but keep a rolling 8-week reference window. The key is consistency: gaps in monitoring reduce interpretability more than imperfect metrics.
Should we optimize for issue count reduction or impact reduction?
Always optimize for impact reduction. Lower issue count can be misleading if high-severity classes remain unresolved. In mature workflows, teams track high-impact recurrence, time-to-resolution, and incident spread by template class.
What is the best cadence for reporting this topic to leadership?
Weekly operational review plus a monthly executive summary works best. Weekly reports should focus on changes, actions, and blockers. Monthly reports should focus on trend direction, prevented incidents, and business-risk reduction. This two-layer model avoids both over-reporting and under-reporting.
How do we keep collaboration smooth with engineering teams?
Convert every finding into an implementation-ready task: define affected scope, expected behavior, acceptance criteria, and verification method. Engineering teams respond faster when tasks are deterministic. Avoid sending raw issue exports without business context.
When should we escalate from soft monitoring to stricter controls?
Escalate when any of the following is true: critical template regressions appear repeatedly, recovery time is increasing, or ownership is unclear across incidents. At that point, tighten alert policy, enforce scope ownership, and add stricter verification gates after releases.
How do we evaluate ROI for this workflow?
ROI appears in three layers: lower incident duration, fewer recurring regressions, and improved implementation confidence across teams. For stakeholder communication, quantify prevented loss events and reduced recovery effort rather than raw technical counts. This framing translates technical monitoring into business language that supports budget decisions.