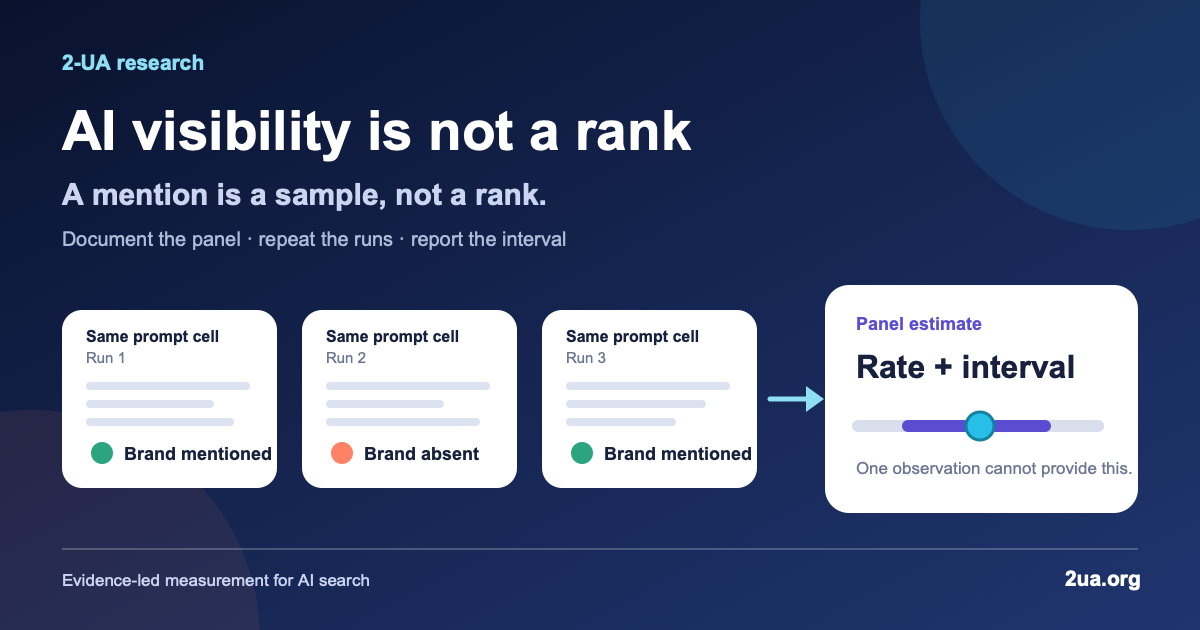
A team checks one buying prompt on Friday. Its brand appears in the answer, above two competitors, so the screenshot goes into the board deck as “AI rank: #1.” On Monday the same prompt names different brands. The team now has two incompatible stories, neither of which can justify a content investment. The first answer was not a rank. It was one observation from a system whose retrieval, model, context, and wording can all change the result.
That distinction is expensive when it is ignored. A one-prompt dashboard can turn sampling noise into an optimization brief, reward pages tied to no real customer intent, and declare a winner after a movement too small for the measurement to resolve. A useful alternative is a documented prompt panel: a fixed set of commercially relevant intent families, deliberate wording variants, declared platform contexts, repeated runs, and a change rule written before the result is visible. The output is an estimate with uncertainty—not a synthetic league table.
The answer in one minute
- A mention is a sample, not a rank. Record the exact prompt, surface, context, time, and run. One answer supports only a claim about that observation.
- Define the population before the score. Decide which customer intents, markets, languages, devices, and AI products the panel is meant to represent.
- Sample wording and execution separately. Paraphrases test whether the panel represents an intent; reruns estimate variation for the same prompt cell.
- Report an interval beside every rate. A point estimate without its denominator and uncertainty looks more precise than the process is.
- Learn the noise floor before measuring improvement. Baseline variation tells you how large and persistent a movement must be before it can change a decision.
- Version the entire measurement contract. A changed prompt library, platform, retrieval setting, scoring rule, or collection method requires disclosure and usually a bridge baseline.
1. Why AI visibility is not a rank
A classic search rank describes an ordered result on a specified search surface, query, place, device, and time. It is already conditional, but the result page exposes the ordered list. A generated answer is structurally different. It can fan one question into related searches, retrieve a changing pool of documents, synthesize a response, omit an explicit ordered list, and display citations whose order does not equal their influence. Google says AI Overviews and AI Mode may use query fan-out, may use different models and techniques, and may therefore show different links and responses.8 Google does not publish a stable “rank” for a domain inside each generated answer.
The observable event is narrower. For a given prompt cell and execution, a brand may be mentioned, recommended, cited, described accurately, or absent. Those are different outcomes. “Acme was mentioned in 18 of 60 recorded runs” is measurable. “Acme ranks third in AI” quietly compresses prompts, platforms, paraphrases, markets, run variation, scoring choices, and time into one position that the underlying interface never emitted.
Peer-reviewed evidence shows why that compression fails. Kirsten and colleagues compared Google organic search with five generative-search configurations over 4,706 English queries in the United States and Germany. Between two collection periods, Google AI Overview retained only 18% of its source pages, compared with 45% for organic search. In a separate ternary-answer test, answer polarity changed in up to 27% of cases after five minutes and 28% after 24 hours, depending on the system and condition.1 These are not universal volatility constants. They are direct evidence that a source set or answer observed once should not be reported as a durable position.
The measurement language should follow the event. Use mention rate for runs that contain the brand, recommendation rate for runs that endorse it under a declared rubric, citation rate for runs that display its URL or domain, and accurate support rate for answers in which its content supports a material claim correctly. Keep each numerator, denominator, panel version, and platform visible. If a vendor combines them into “visibility,” require the exact formula and the unblended components.
2. The evidence describes three different kinds of instability
The same prompt can produce different answers
Run-to-run variation is the easiest instability to see. Retrieval indexes change, product systems route requests differently, model sampling is not perfectly deterministic, and an answer engine can choose a different set of supporting pages. Even at zero temperature, Kirsten et al. reported mean lexical Jaccard similarities from 0.27 to 0.63 across the systems they could configure. In plain language, repeated answers often shared well under two-thirds of their lexical content.1
A preprint focused on commercial recommendations provides a more task-specific baseline. Jack and colleagues ran 50 buying prompts 30 times in each of four OpenAI and Anthropic model-and-effort cells, producing 6,000 same-prompt runs. The prompt-averaged Jaccard overlap of recommendation sets was 0.50–0.61; retrieved-domain overlap was 0.40–0.74.2 The study is vendor-affiliated, single-day, English, and Western-market-skewed. Its exact values should not be pasted into another dashboard as universal assumptions. Its useful lesson is methodological: measure your own rerun distribution before interpreting week-to-week movement.
Equivalent wording can change the observed brand set
Prompt wording creates a second, separate uncertainty. In the same preprint, natural cosmetic paraphrases such as synonym swaps or structural rewrites produced a recommendation-set Jaccard of 0.288, with a clustered 95% confidence interval of 0.215–0.361. Constraint-adding variants—such as market, language, modifier, or company-size changes—produced 0.135, with a 0.098–0.175 interval. Both sat below the study’s same-prompt rerun baseline.2
Do not interpret that as “paraphrases are noise.” A phrase like “CRM for a 20-person SaaS company in Germany” expresses a narrower need than “best CRM.” The buyer segment has changed, so some recommendation change is desirable. The design implication is to label the variation. Cosmetic variants test surface-form sensitivity within one intended need. Constraint variants represent distinct customer subgroups and should usually be reported as their own strata, not averaged away.
The panel itself can ask the wrong question precisely
The third instability is not a model behavior; it is a construct problem. A team can rerun 10 opaque prompts a thousand times and obtain a narrow interval for those exact strings. It still has no defensible estimate of visibility across customer needs it omitted. NIST’s 2026 evaluation guidance makes the general distinction: performance conditioned on a fixed benchmark is different from generalized performance on similar unseen items.10 A fixed prompt panel is valuable, but the claim must remain bounded to the population it was designed to approximate.
Earlier benchmark research spanning more than 280 models and checkpoints across 13 NLP benchmarks likewise found that prompt and random-seed choices introduce variance that a single score can hide.11 That work is not an AI-search study, so it supports the evaluation principle rather than a claim about any answer engine's current behavior.
This is why repetitions and prompt breadth solve different problems. More reruns can improve precision for a fixed prompt cell. More representative intents, paraphrases, and markets improve coverage of the target population. Neither automatically fixes the other. OpenAI’s contextual-evaluation guidance reaches the same construct lesson from a product perspective: define success, use real-world conditions and representative examples, and continue measuring real inputs rather than relying on a demo.57
3. Write the measurement contract before collecting answers
A prompt library becomes a measurement panel only when it has a declared estimand: the quantity the team intends to estimate. A practical example is: “The average probability that our brand is recommended in English, logged-out, web-enabled answers to the version 1.0 UK small-business payroll panel during August 2026.” That sentence excludes many things on purpose. It does not claim all countries, every language, logged-in personalization, research prompts, every model, all future versions, citations, sentiment, or revenue.
The IAB’s August 2026 framework now provides the clearest current disclosure baseline. It asks providers to document responses per query, total query volume, intent distribution, collection architecture, live-retrieval setting, platform coverage, aggregation, typical rerun variation, confidence levels, and prompt-library construction. It treats fewer than 50 queries in a measurement program as exploratory, not directional, and requires a more diverse, transparent library for decision-grade use.4 That 50-query floor is an industry rule, not a platform-independent power calculation. Your required sample still depends on the estimand, baseline rate, clustering, detectable effect, and cost of a wrong decision.
Use the following twelve-field specification. Store it beside the raw answers and include the panel version in every report.
| Field | What to declare | Failure if omitted |
|---|---|---|
| Decision | The action this evidence may change | Interesting data with no threshold |
| Estimand | The exact rate, mean, or distribution being estimated | One score silently changes meaning |
| Target population | Customer intents, personas, markets, languages, and journey stages | Panel cannot support the reported generalization |
| Panel | Prompt text, intent family, paraphrase role, weight, source, and version | Prompt-choice artifact is invisible |
| Platform context | Product/surface, model label if exposed, account state, market, retrieval, and device | Unlike conditions are blended |
| Run design | Runs per cell, schedule, interleaving, and observation window | Time drift and burst effects are confused |
| Raw capture | Answer, citations, timestamp, errors, refusals, and available product metadata | Scores cannot be audited |
| Outcome rubric | Mention, recommendation, citation, portrayal, support, and entity rules | Different events are counted together |
| Uncertainty method | Sampling unit, interval/model, clustering, and assumptions | Precision is overstated |
| Noise floor | Expected baseline variation by important panel stratum | Normal movement becomes a campaign win or loss |
| Version policy | What triggers a new version, bridge sample, or broken time series | Method changes masquerade as performance changes |
| Business link | Separate visits, leads, sales, assisted demand, and attribution strength | Visibility is mislabeled as ROI |
4. Build intent families before writing prompt variants
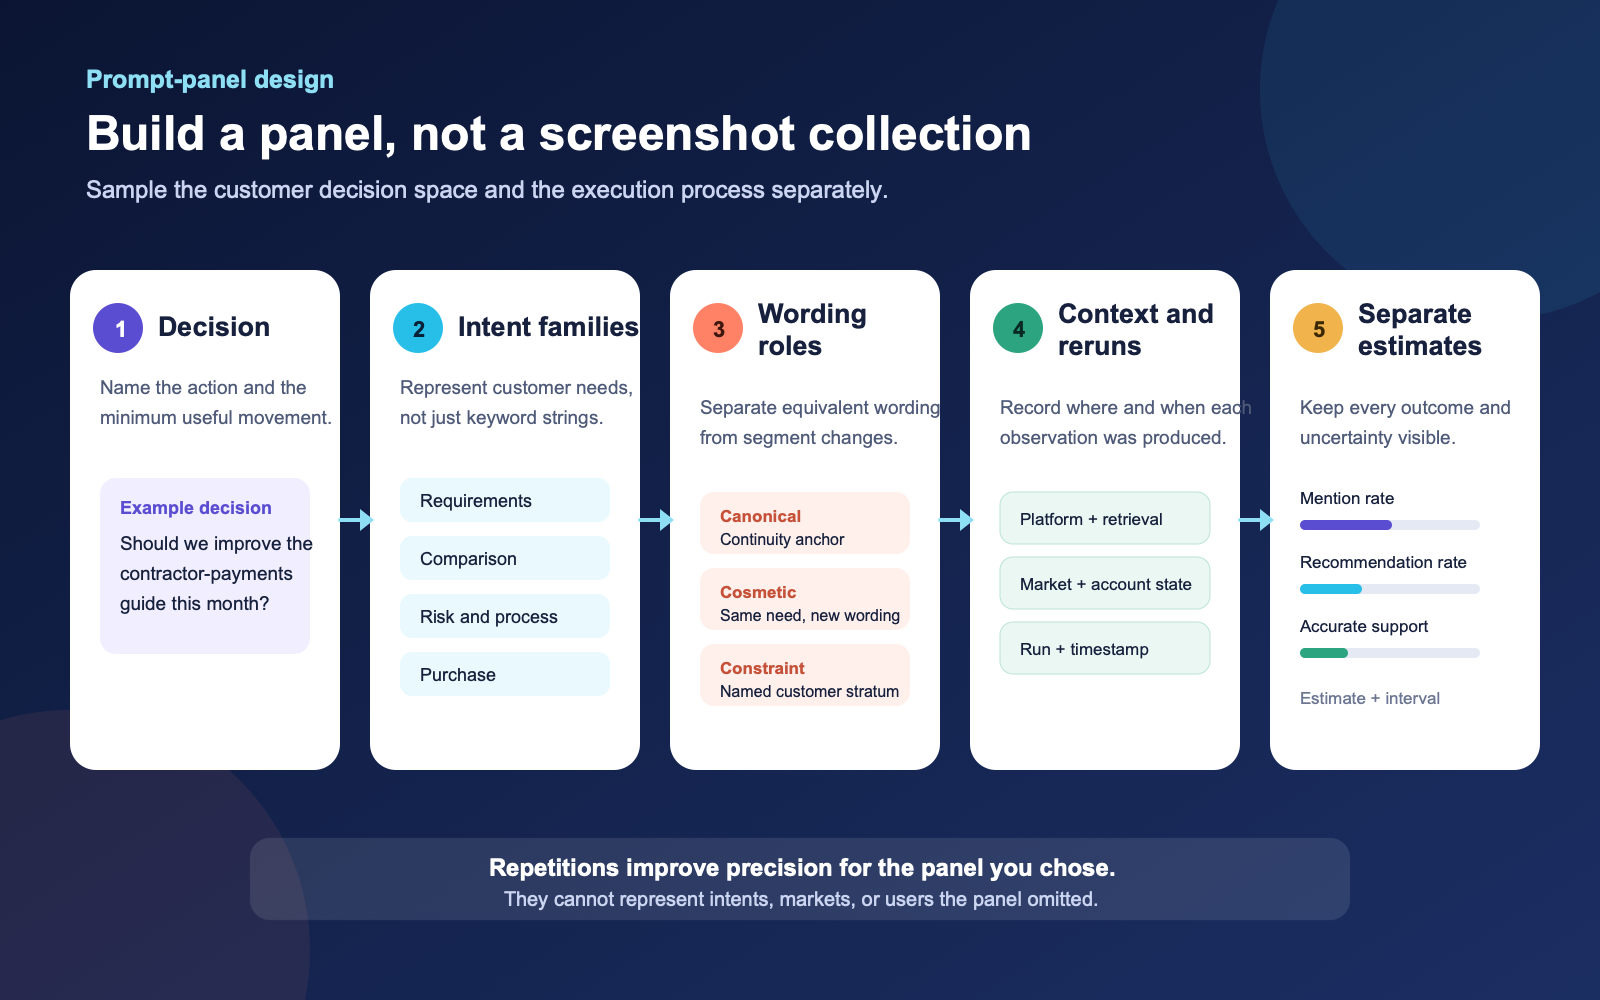
Start with customer decisions, not a list of high-volume keywords. Interview sales, support, product, and customer-success teams. Review on-site search, Search Console queries, paid-search terms, call notes, community language, and win/loss records where privacy and permissions allow. Group the resulting needs into families such as problem definition, requirements, comparison, risk, implementation, alternatives, price, and purchase. A payroll platform might use “How do I run payroll for hourly staff?”, “Payroll software for a 25-person UK company,” “Acme versus Beta for contractor payments,” and “What happens if payroll is filed late?” These are different decision tasks, not four spellings of one keyword.
For each family, create three kinds of prompt items. A canonical item makes the intent unambiguous and provides continuity over time. Cosmetic variants preserve the need while changing natural wording, order, or synonyms. Constraint variants deliberately change a segment—country, language, company size, budget, product compatibility, urgency, or regulation—and become separate strata. Record which role each item plays. Otherwise, a real segment difference is misdiagnosed as model noise.
Avoid generating the entire panel from one language model. Sielinski’s uncertainty preprint used ChatGPT to create 200 queries in each of three consumer topics, a transparent choice that the author also lists as a representativeness limitation because the generator may carry implicit topic-source associations.3 Synthetic expansion is useful after real-language anchors exist. Human reviewers should remove implausible questions, near duplicates, leading brand insertions, and variants that quietly change the decision.
Weighting needs the same honesty. Equal weighting estimates the average over the panel items, not the average over real users. Search-volume weights approximate classic query demand, which may differ from AI-product behavior. Sales-stage weights embed a commercial priority, not population prevalence. You can use any of these if the report names the choice and preserves unweighted strata. Never claim the weighting is “how customers prompt” without observed, permissioned behavioral data.
5. Estimate the noise floor before evaluating a campaign
The noise floor is the movement your unchanged measurement process produces. Establish it before changing content. Hold the panel version, scoring, platform context, and collection method fixed. Repeat the same cells across enough times and days to expose run variation and routine temporal variation. Interleave platforms and prompt families rather than sending one whole group first and another hours later. Record outages, refusals, missing search, and rate-limit artifacts instead of silently dropping them.
Sielinski’s preprint illustrates why one universal run count is unsafe. Across three platforms, three consumer topics, nine daily jobs, and hundreds of thousands of extracted citations, response-level overlap and interval convergence differed materially by platform and topic. In that dataset a five-percentage-point citation-share interval-width target was reached around 30–50 queries for Gemini and 90–100 for Perplexity, while some SearchGPT cells did not meet it within 200 queries.3 Those figures are study results, not buying advice. They show that precision must be measured for the actual panel rather than borrowed from another product and category.
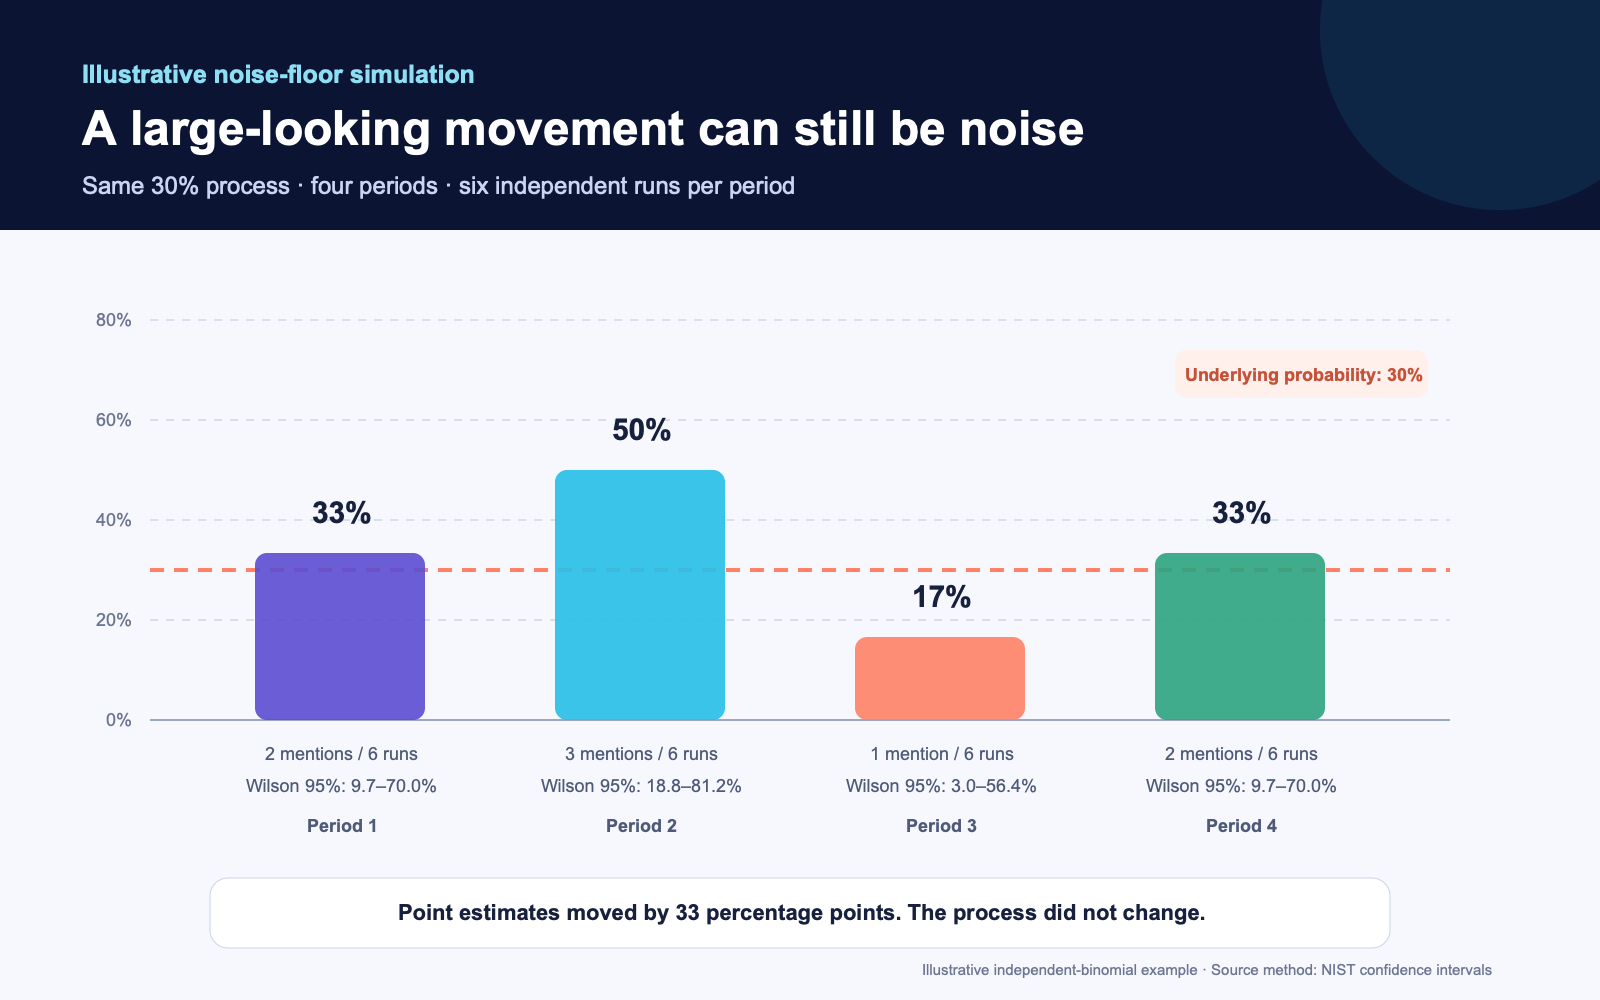
The illustrative graphic below holds the underlying mention probability at 30% and shows four six-run samples. The displayed point estimates jump from 17% to 50% even though the process has not changed. With only six independent observations, Wilson intervals are wide. Real prompt panels are usually less convenient: runs share prompts, intents, platforms, and time windows, so observations are clustered and the effective information can be lower than the raw row count suggests.
Turn the baseline into a rule. For example: “Do not label a panel-wide change as directional unless it exceeds the 95th percentile of unchanged week-to-week movement, appears in two consecutive collection windows, and is not driven by one prompt family or a scoring change.” A higher-stakes decision—budget reallocation, site-wide rewrite, agency compensation—needs more: a predeclared minimum effect, an appropriate pre/post or control design, uncertainty that excludes changes too small to matter, and corroboration from first-party business signals.
6. Put a confidence interval beside the point estimate
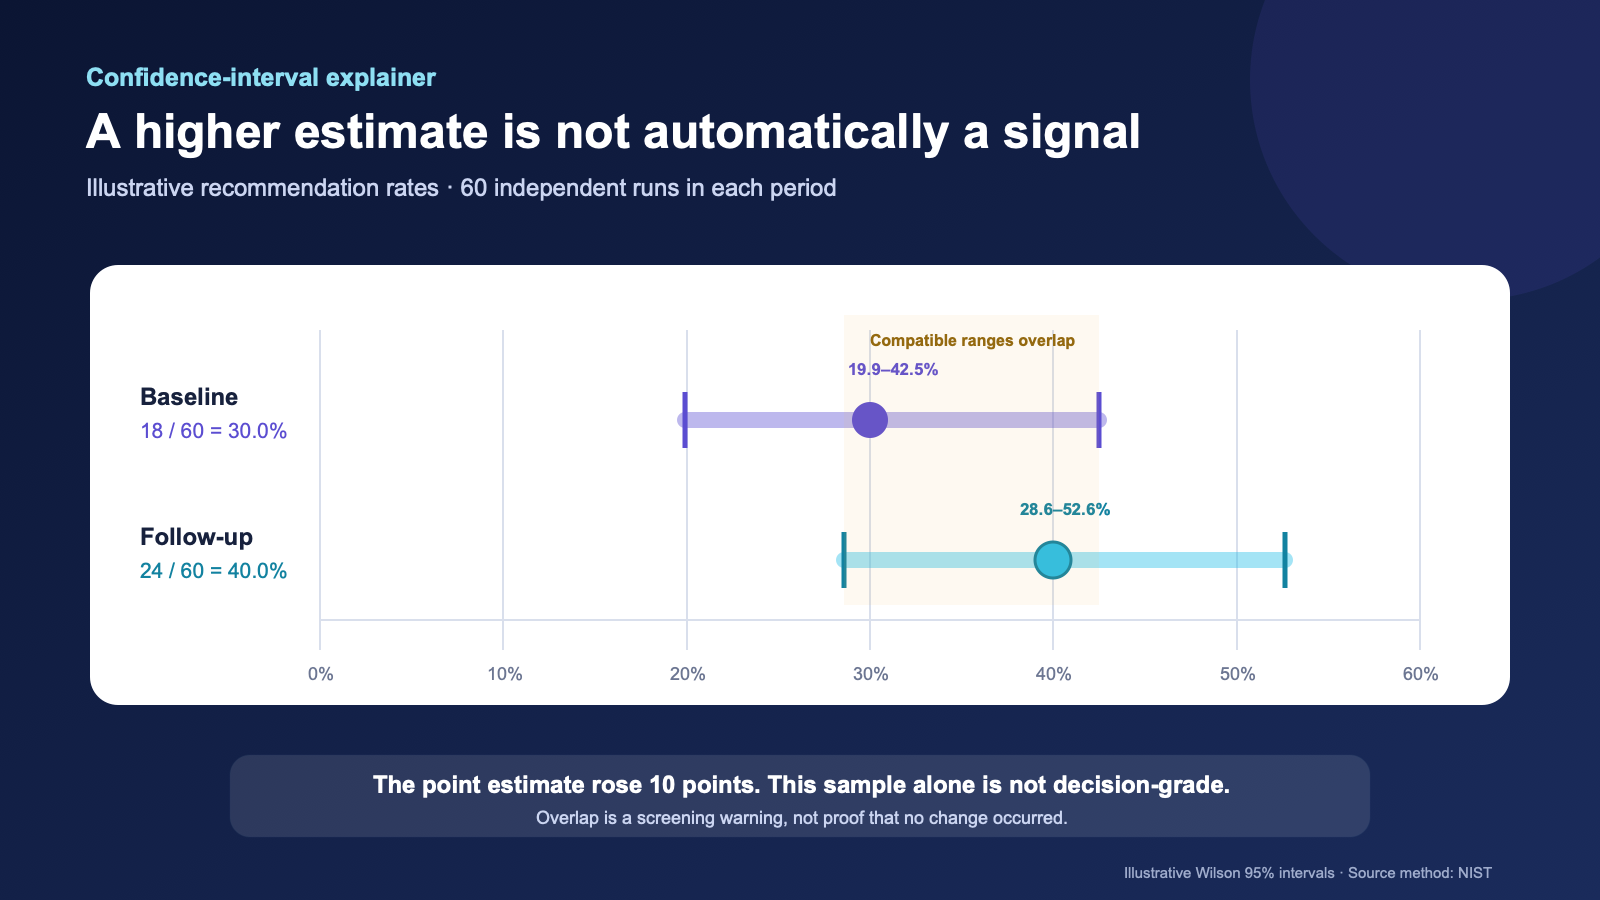
Suppose a brand is recommended in 18 of 60 captured runs. The point estimate is 30.0%. A Wilson 95% interval is approximately 19.9%–42.5%. In a follow-up, it appears in 24 of 60 runs: 40.0%, with an interval around 28.6%–52.6%. The point estimate rose ten percentage points, but the ranges overlap substantially. That does not prove “no change.” It means this sample alone cannot cleanly separate a persistent movement from ordinary sampling variation under the stated model.
Frequentist confidence needs careful wording. A 95% confidence procedure means that across many repeated samples under the model assumptions, about 95% of the constructed intervals would contain the fixed parameter. It does not mean there is a 95% probability that this already computed interval contains the value.9 The distinction matters less to an executive than the operational translation: report a range of compatible values, name the assumptions, and avoid decisions the measurement cannot resolve.
Choose the method around the outcome and sampling unit. A Wilson interval is a reasonable simple display for a binary rate when observations are plausibly independent. Citation share is a ratio with a changing denominator; Sielinski recomputes numerator and denominator inside a response-level bootstrap.3 Repeated runs nested inside prompts and prompts nested inside intent families are clustered. A cluster bootstrap or hierarchical model can preserve that structure. NIST AI 800-3 shows why explicit statistical models help separate item and system variation instead of pretending every row is exchangeable.10
Do not stop collection the first time the interval becomes attractive. If the platform or query distribution shifts during the run, a running interval can narrow and widen non-monotonically. Commit to a collection plan in advance; log exclusions; and run sensitivity checks with and without errors, dominant prompts, and low-frequency entities. A narrow interval around a biased score is precise but still wrong.
7. A worked prompt-panel example
Consider a small B2B payroll company deciding whether to rewrite its contractor-payments guide. Its decision is not “improve AI visibility.” The decision is: “Invest one editorial week if the guide’s accurate recommendation rate improves by at least 12 percentage points for UK small-business contractor-payment intents, without reducing accuracy or organic conversions.” The minimum effect is commercial judgment, written before the answers are collected.
The team defines four intent families: choosing software, comparing contractor support, understanding compliance workflow, and troubleshooting a failed payment. Each has one canonical prompt and two cosmetic variants. Company-size and country constraints are kept as named strata, not mixed into cosmetic variants. The initial panel therefore contains 12 items. It is below the IAB’s 50-query directional floor and is explicitly labelled an exploratory small-site panel.4
The team checks two answer products its customers actually use, in a fixed logged-out UK context where available. It runs every item three times on three non-consecutive baseline days: 12 prompts × two products × three runs × three days = 216 raw observations. The large row count does not make the design representative of every UK buyer. It produces repeated evidence for twelve declared prompt items. The dashboard reports each product, intent family, and canonical/cosmetic stratum separately before showing an equal-weight panel average.
Two reviewers define an accurate recommendation as an explicit endorsement where the answer correctly states the product’s current contractor capability and does not invent pricing or regulatory coverage. They double-code 20% of answers, reconcile disagreements, and version the rubric. Mentions, recommendations, citations, accurate recommendations, and referrals remain separate columns. A hallucinated brand reference counts as a mention and an accuracy failure, not a visibility win.
After the baseline, the team improves only the target guide: current supported countries, fee calculation, evidence source, updated screenshots, a decision table, and a prominent boundary for businesses that need employer-of-record services. A matched payroll-comparison page remains unchanged. After recrawl time, the exact panel and schedule run again. The target’s point estimate rises, but the team changes course only if the effect exceeds its declared threshold, survives its clustered uncertainty analysis, appears across more than one intent family, is not mirrored on the control page, and keeps accuracy and conversion safeguards intact.
8. Use this practical measurement specification
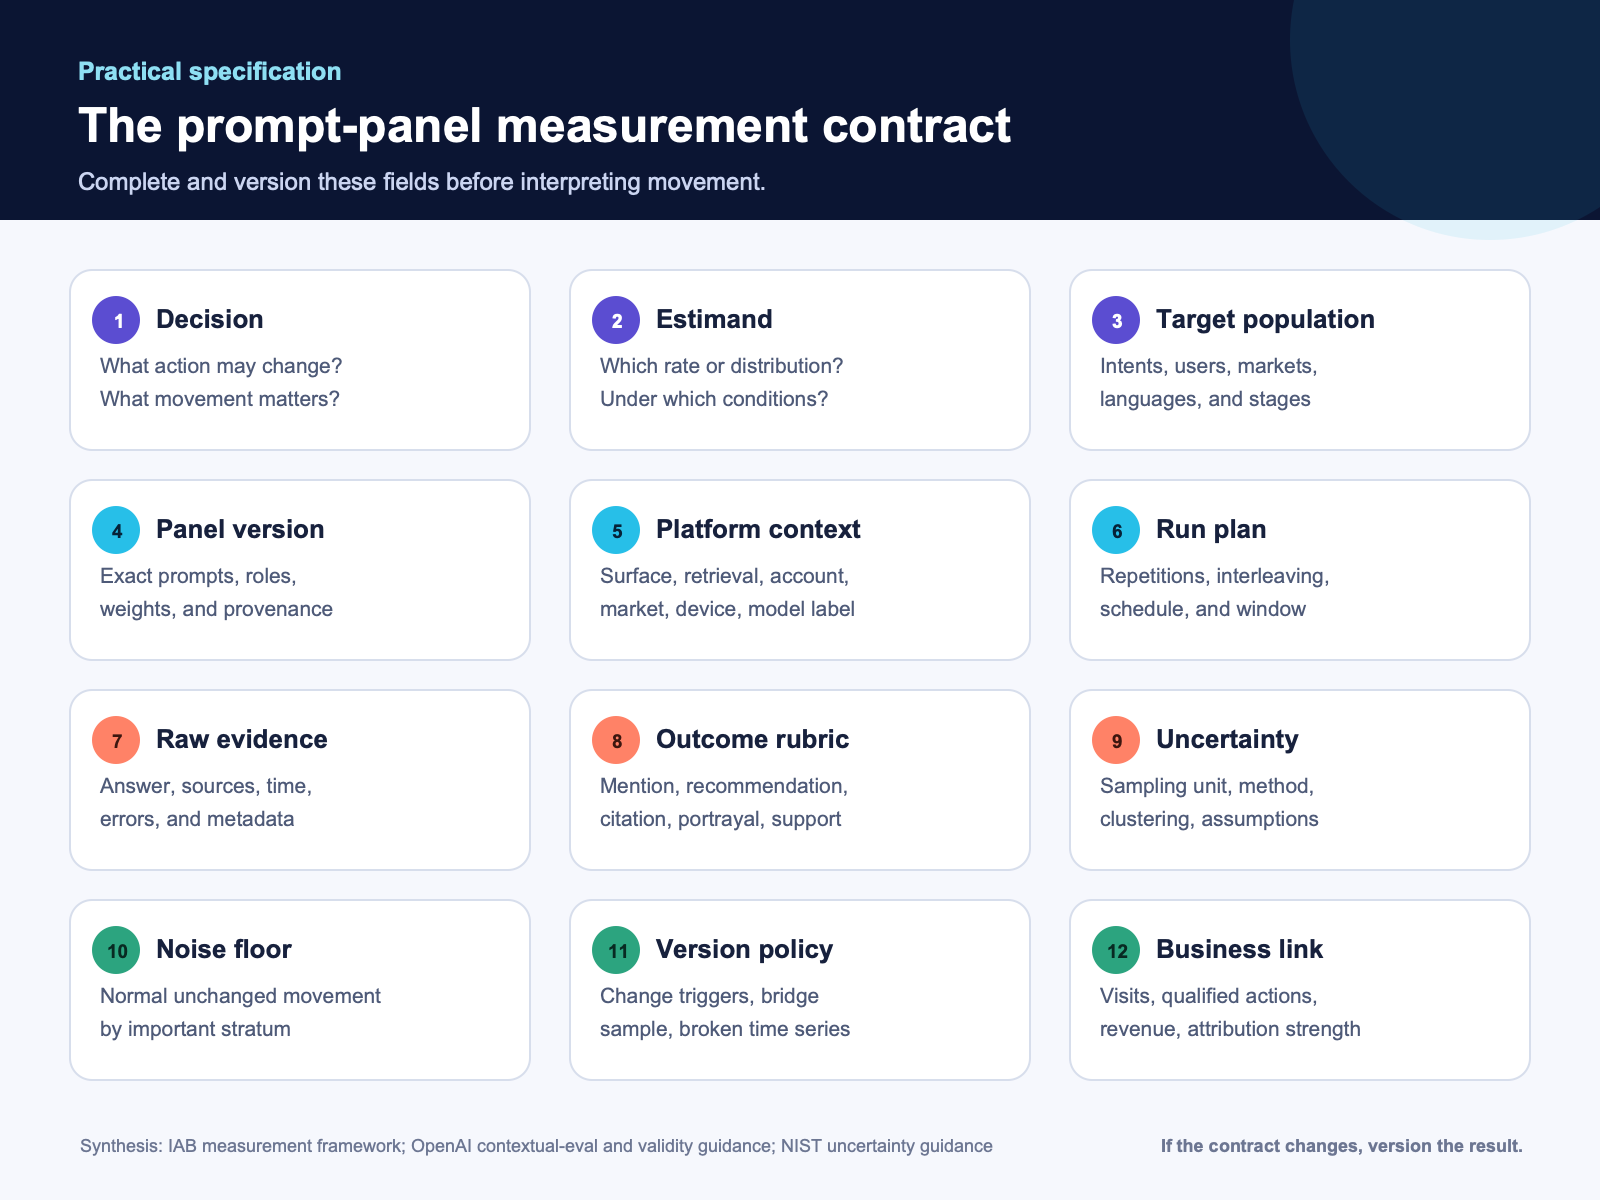
Panel construction checklist
- Write the business decision and minimum meaningful change before collecting answers.
- Define the estimand in one sentence, including outcome, population, panel version, context, and time window.
- Build intent families from customer evidence; identify where inputs are synthetic, weighted, or editorially selected.
- Label canonical prompts, cosmetic paraphrases, and constraint strata. Do not pool them silently.
- Record the exact text, item weight, source, reviewer, date added, and reason for every panel item.
- Separate platforms and product surfaces. Publish the weighting basis for any combined score.
Collection and scoring checklist
- Fix or record market, language, account state, retrieval setting, device, model label, and tool access where the product exposes them.
- Interleave prompt families and platforms; spread repetitions across the time window relevant to the decision.
- Keep raw answers, displayed sources, timestamps, errors, and available response metadata where terms and privacy rules permit.
- Define entity resolution and every outcome rubric before automated extraction. Preserve unknown and ambiguous states.
- Human-review a stratified sample, including apparent wins, misses, hallucinations, and low-confidence automated labels.
- Report numerator, denominator, exclusions, point estimate, interval, and panel version for every consequential rate.
Change-control checklist
- Establish unchanged baseline variation before a content, technical, or PR intervention.
- Use a matched control when the cost and expected value justify it; record other concurrent changes.
- Do not edit the panel after seeing a result without incrementing the version and explaining the change.
- Bridge old and new methods by running both during an overlap window when continuity matters.
- Keep prompt-panel outcomes separate from visits, assisted demand, leads, sales, and causal incrementality.
- Allow “insufficient evidence” as a valid decision when the compatible range crosses the action threshold.
9. What to measure for 30 days
Days 1–3: specify. Choose one commercially relevant decision. Write the estimand, target population, minimum effect, panel strata, scoring rubric, platform contexts, and version policy. A small site can start with an exploratory panel; an enterprise should use observed customer inputs, market sampling, formal weighting, and privacy review. Both must state what the panel cannot represent.
Days 4–10: baseline. Run the unchanged panel on a schedule that covers the normal operating window. Capture raw evidence and annotate a sample. Calculate results by prompt family and platform before any aggregate. Inspect dominant items, missing searches, refusals, entity collisions, and reviewer disagreement. The purpose is to learn how the instrument behaves, not to create a positive headline.
Days 11–14: intervene once. Change one defined bottleneck: crawl eligibility, evidence accuracy, page usefulness, content freshness, internal discovery, or public brand facts. Do not combine a site migration, PR campaign, panel rewrite, and content test if the goal is diagnosis. Log the release time and affected URLs. Leave a relevant control unchanged when possible.
Days 15–24: repeat. Allow realistic recrawl and retrieval time, then execute the same panel under the same context. Continue scoring blind to baseline labels where feasible. Watch whether movement is broad or concentrated in one prompt string. A single spectacular answer is a qualitative example, not the estimate.
Days 25–30: decide. Compare the effect with the predeclared threshold and observed noise floor. Check interval/model assumptions, panel strata, control movement, concurrent events, accuracy, referrals, and conversions. Continue when a persistent, commercially relevant effect exceeds the threshold without a guardrail failure. Iterate when the panel reveals a specific error. Stop when the topic lacks economic value or the change damages reader usefulness. Extend the test when the result is still unresolved.
10. The strongest counterposition
The strongest reasonable objection is that a constructed prompt panel can never represent private user conversations. Personalization, account history, geography, product updates, hidden query fan-out, platform routing, and multi-turn context remain unavailable. More prompts may simply make a synthetic instrument look scientific. The paraphrase study itself says the natural phrasing space is much larger than a commercial tracker can exhaust.2
That objection defeats broad “share of AI mind” claims. It does not defeat bounded measurement. A panel can answer whether a brand’s recommendation rate changed for a published set of customer-informed prompts under declared conditions. It can reveal inaccurate portrayals, unstable prompt families, citation eligibility problems, and differences between products. It can support a directional content decision if the effect is large, persistent, and commercially relevant. The honest move is to narrow the claim, not abandon observation or inflate it into population truth.
The harness matters too. OpenAI’s evaluation-validity playbook argues that tasks, tools, budgets, scoring, and surrounding setup are part of the result; a changed setup can change what an evaluation appears to show.6 Applying that principle to prompt panels is editorial judgment, but a strong one: keep the environment stable for comparison, disclose changes, and re-baseline when continuity would otherwise be fictional.
Small-site and enterprise boundaries
A small site should optimize for learning per dollar. Track one customer decision, two or three intent families, the products customers actually use, and a schedule the team can sustain. Keep the raw sheet and exact prompts. Report the work as exploratory when the panel is small. Spend the saved API and review budget on accurate content, conversion tracking, and customer interviews. False precision is not an enterprise feature worth imitating.
An enterprise faces the opposite risk: millions of observations can hide a changing construct. It needs panel governance, stratified sampling, access and privacy controls, automated entity resolution with human audits, prompt-source provenance, platform-specific reports, versioned rubrics, bridge studies, and sensitivity analysis. The domain-wide score belongs at the end of that system, not the beginning, and executives should still see the largest strata and the compatible range.
11. What the evidence does not show
Claims this guide does not support
- “Every brand needs exactly 50 prompts.” The IAB uses 50 as a normative exploratory floor; S3 shows sample needs vary by platform, topic, metric, and target precision.
- “Three or ten reruns make a prompt reliable.” No reviewed primary source establishes one universal repetition count.
- “The S2 paraphrase values describe all AI products.” S2 is a vendor-affiliated preprint about English commercial recommendations in a single-day design.
- “The S3 platform values are permanent benchmarks.” S3 is a single-author preprint covering three consumer topics during one short observation window.
- “A 95% confidence interval contains the true value with 95% probability.” That is not the frequentist interpretation used here.
- “Overlapping intervals prove nothing changed.” Overlap is a conservative warning; a paired or hierarchical analysis may use the design more efficiently.
- “More repetitions fix a biased prompt library.” They improve precision for the chosen items, not coverage of omitted customers and intents.
- “A combined AI visibility score is comparable across vendors.” It is not comparable without aligned prompts, populations, collection methods, platforms, rubrics, weights, and versions.
- “A prompt-panel increase proves an edit caused it.” Platform drift, retrieval changes, concurrent activity, scoring changes, and sampling variation remain alternative explanations.
- “Visibility proves ROI.” Mentions, recommendations, citations, accurate support, visits, leads, revenue, and incrementality are separate outcomes.
12. What to do this week
- Delete “AI rank” from the report. Replace it with the observable outcome, panel version, numerator, denominator, platform, and period.
- Choose one paid customer decision. Build intent families around a real comparison, objection, risk, or implementation problem.
- Publish the prompt sheet internally. Label canonical, cosmetic, and constraint items; document source and weighting.
- Write the scoring rubric. Separate mention, recommendation, citation, accurate portrayal, and unsupported claim.
- Collect an unchanged baseline. Learn rerun and time variation before changing the page or campaign.
- Add intervals and a noise threshold. If the sample cannot resolve the minimum useful effect, say so.
- Version changes. Keep a bridge sample when prompts, context, platforms, extraction, or scoring change.
- Connect—not collapse—the business layer. Compare visibility observations with referrals, qualified actions, and revenue while preserving attribution limits.
The goal is not to make AI visibility perfectly stable. The systems and customer questions are not stable in that way. The goal is to make the decision process inspectable: define the customer space, document the panel, repeat the observations, quantify compatible values, learn the normal variation, and change course only when the signal is large enough for the business decision. A generated answer can be useful evidence. It becomes misleading only when one sample is promoted into a rank it never was.
Primary references
- Kirsten et al., “Characterizing Web Search in The Age of Generative AI”, Findings of ACL 2026.
- Jack et al., “Paraphrase Brittleness in Production Retrieval-Augmented Commercial Recommendation”, arXiv preprint, May 2026.
- Sielinski, “Quantifying Uncertainty in AI Visibility: A Statistical Framework for Generative Search Measurement”, arXiv preprint, revised June 2026.
- IAB, “Measuring Visibility in the AI Era”, August 3, 2026.
- OpenAI, “How evals drive the next chapter in AI for businesses”, November 19, 2025.
- OpenAI, “A shared playbook for trustworthy third party evaluations”, May 29, 2026.
- OpenAI API documentation, “Working with evals”, accessed August 21, 2026.
- Google Search Central, “AI features and your website”, updated December 10, 2025.
- NIST/SEMATECH, “What are confidence intervals?”, Engineering Statistics Handbook.
- Keller et al., “Expanding the AI Evaluation Toolbox with Statistical Models”, NIST AI 800-3, February 17, 2026.
- Madaan et al., “Quantifying Variance in Evaluation Benchmarks”, NeurIPS 2024 Regulatable ML workshop/arXiv.