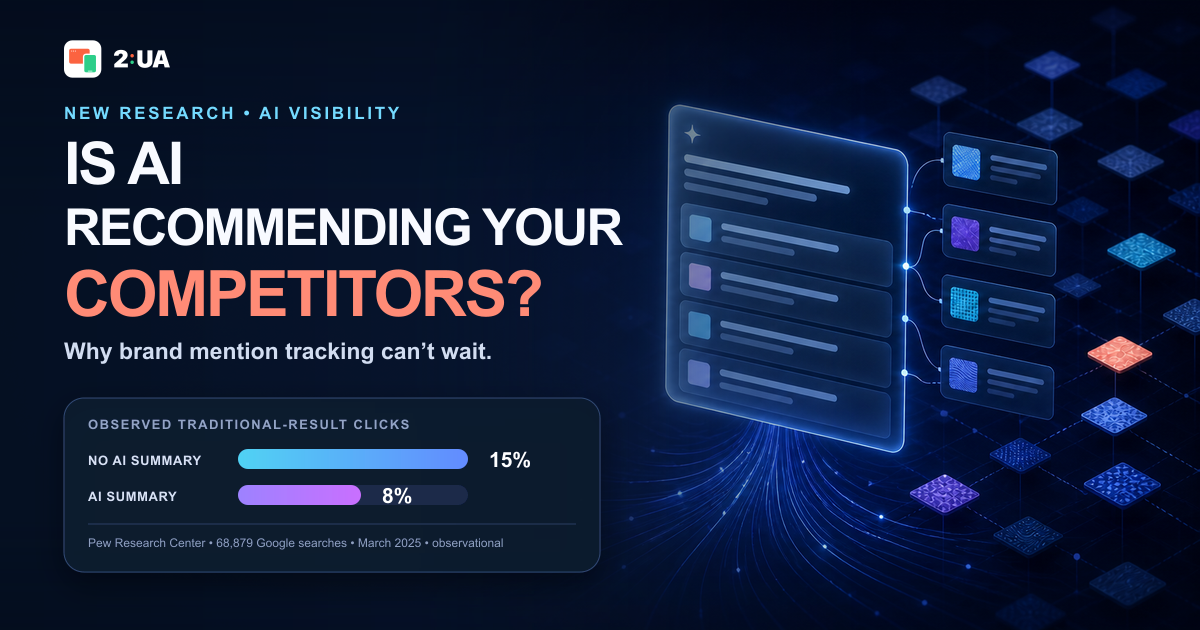
AI-generated answers are becoming a distinct layer of product and brand discovery. They do not simply reproduce a search results page: they select entities, synthesize claims, attach sources unevenly, and often resolve part of a decision before any website visit occurs. That creates a measurement problem. A brand can be recommended without receiving a click, omitted while competitors are named, described inaccurately, or supported by a source it does not own.
Conventional analytics observes only a fraction of those events. The practical question is therefore no longer whether AI assistants will matter someday. It is whether a company can see what current answer engines say about its brand, which competitors they prefer, which evidence they cite, and how stable those results are.
The evidence in one minute
- Reach is material: Google reported more than 2.5 billion monthly AI Overview users and more than 1 billion monthly AI Mode users in June 2026.
- Trust remains conditional: representative YouGov and Pew studies found a large gap between moderate exposure and strong trust.
- Influence can occur without a click: Pew observed fewer traditional-result clicks and more session endings on Google visits containing an AI summary.
- Citations are not truth certificates: experimental research shows that reference links can increase trust even when the support is invalid.
- A screenshot is not a baseline: sources and brand recommendations vary across engines, prompts, runs, and time.
Abstract
This article synthesizes primary research published in 2025 and 2026, including representative surveys, a browser-behavior panel, a preregistered randomized experiment, a peer-reviewed citation experiment, large-scale audits of AI answers, an accepted information-retrieval paper, and clearly labeled industry studies. The evidence does not show that AI has replaced traditional search or that every AI mention causes a sale. It does show that AI answers have enough reach, behavioral influence, source divergence, and output instability to justify continuous brand monitoring now.
The defensible measurement object is an observable distribution, not a rank. Each observation should preserve the exact prompt, engine, model, time, answer, citations, brand aliases, competitor mentions, and repeated-run variance. Brand presence, representation, evidence, and downstream outcomes must be reported separately.
1. The AI answer is a decision surface, not merely another referral source
Traditional web measurement begins when a person reaches a property the brand can observe: a website, an application, a marketplace listing, a call, or a store. An AI answer can influence the decision before any of those events.
A prospective customer may ask:
- “What are the best technical SEO audit tools for a small agency?”
- “Which providers support weekly monitoring and competitor comparison?”
- “Is Brand A reliable for a security audit?”
- “Brand A versus Brand B for a multilingual website?”
The answer engine decides which brands enter the candidate set, what attributes are associated with each one, how confidently those claims are stated, and which sources appear to substantiate them. The user may then verify the recommendation through Google, a marketplace, a review platform, a colleague, or a direct visit. The AI interaction influenced the journey, but the later branded search or direct session receives the credit.
This is why “AI referral traffic” is too narrow a proxy for AI influence. It measures attributable clicks from interfaces that expose a referral, not the prior recommendation, omission, comparison, or claim. The defensible proposition is not that every mention produces a conversion. It is that unobserved pre-click exposure is now plausible at sufficient scale to require direct measurement.
2. What counts as an AI brand mention?
For measurement, a brand mention should be defined before data collection. At minimum, an observation contains:
- the exact brand name or a pre-approved alias;
- the full prompt and its intent category;
- the engine, model, mode, locale, and timestamp;
- the unedited answer;
- the brand’s location and role in the answer;
- named competitors;
- cited URLs and domains;
- factual, comparative, or evaluative claims about the brand.
An exact-match presence flag is reproducible, but it is not sufficient. “Brand A is the best choice,” “Brand A is expensive,” and “avoid Brand A” are all mentions with radically different commercial meaning. Appearing first in a prose comparison is also not a conventional search rank. It is better described as answer prominence or relative mention order.
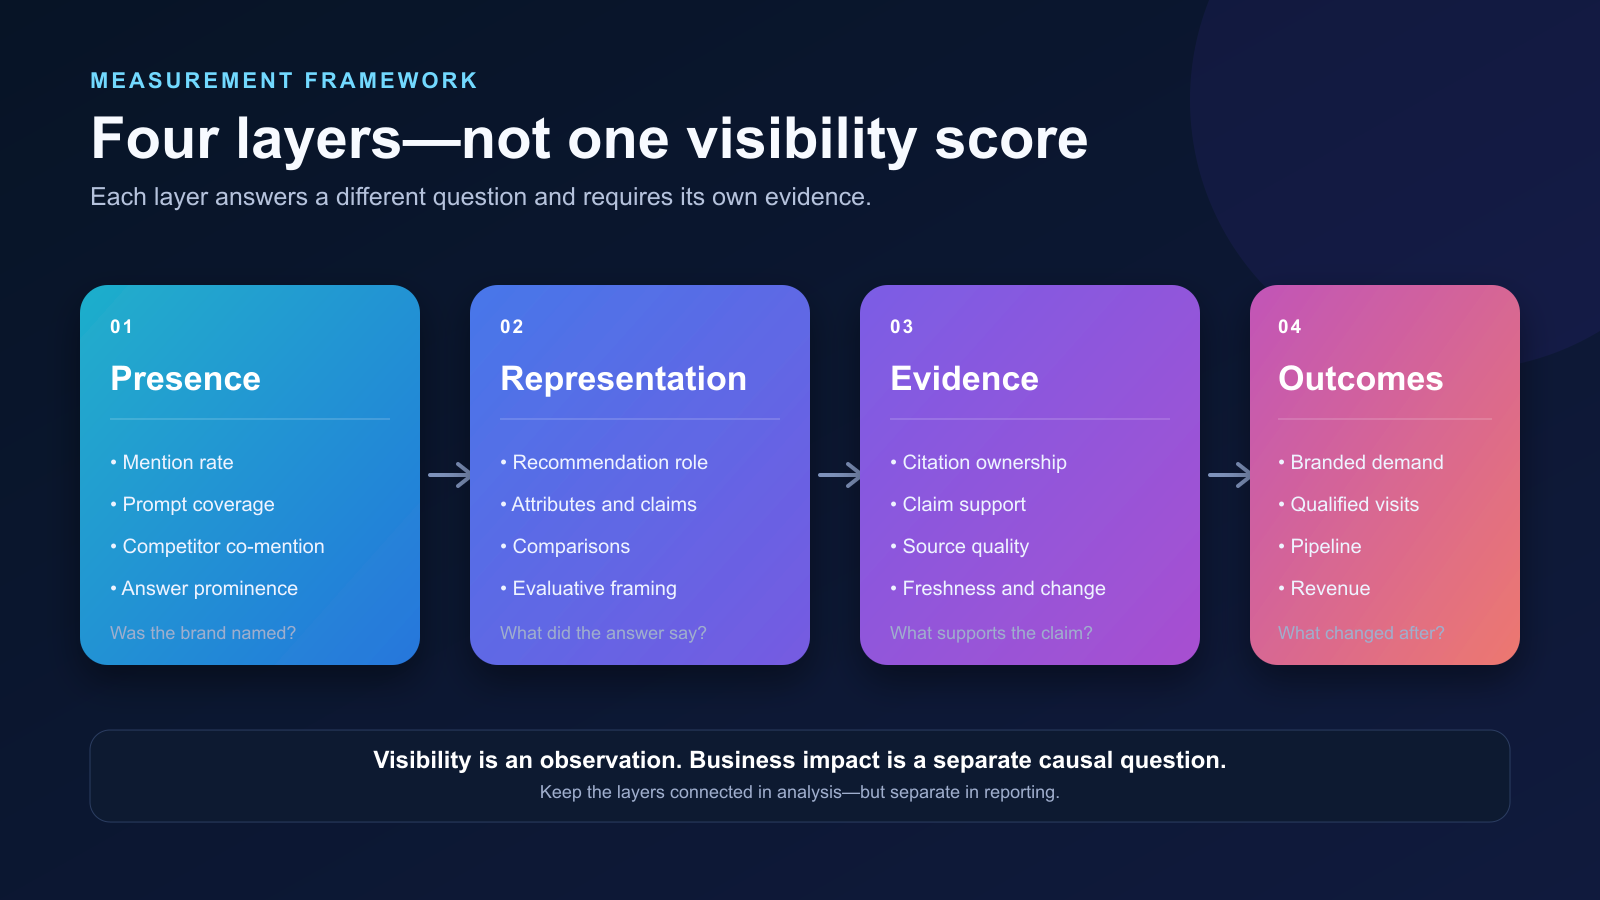
Four separate layers
- Presence: Was the brand named at all?
- Representation: What role, attributes, comparisons, and claims were attached to it?
- Evidence: Which sources were cited, and did they support those claims?
- Outcome: Did branded demand, qualified visits, pipeline, or conversion change afterward?
Collapsing all four into one “AI visibility score” hides more than it reveals.
3. Scale has arrived, although the metrics require caution
Google stated in June 2026 that AI Overviews had more than 2.5 billion monthly users and AI Mode more than 1 billion.1 These are important figures, but they should be described precisely: they are Google’s own product reach claims, not independent estimates of how many purchase decisions were affected.
Survey evidence shows a less dramatic but still meaningful picture. YouGov’s 2026 U.S. Web Search & AI Report surveyed 2,000 adults. Its full report found a substantial stated-trust gap between conventional search and AI assistants: 70% versus 28%, respectively.2 YouGov’s parallel German publication reported that 39% had used AI assistants in the previous 30 days, compared with 79% for search engines; 36% trusted AI assistants as an information source, compared with 72% for search engines. The German sample included 1,005 adults and formed part of a 19-market study.3
Those results do not mean AI is already the default information source. They mean AI has become a material secondary discovery environment while traditional search retains a large trust advantage.
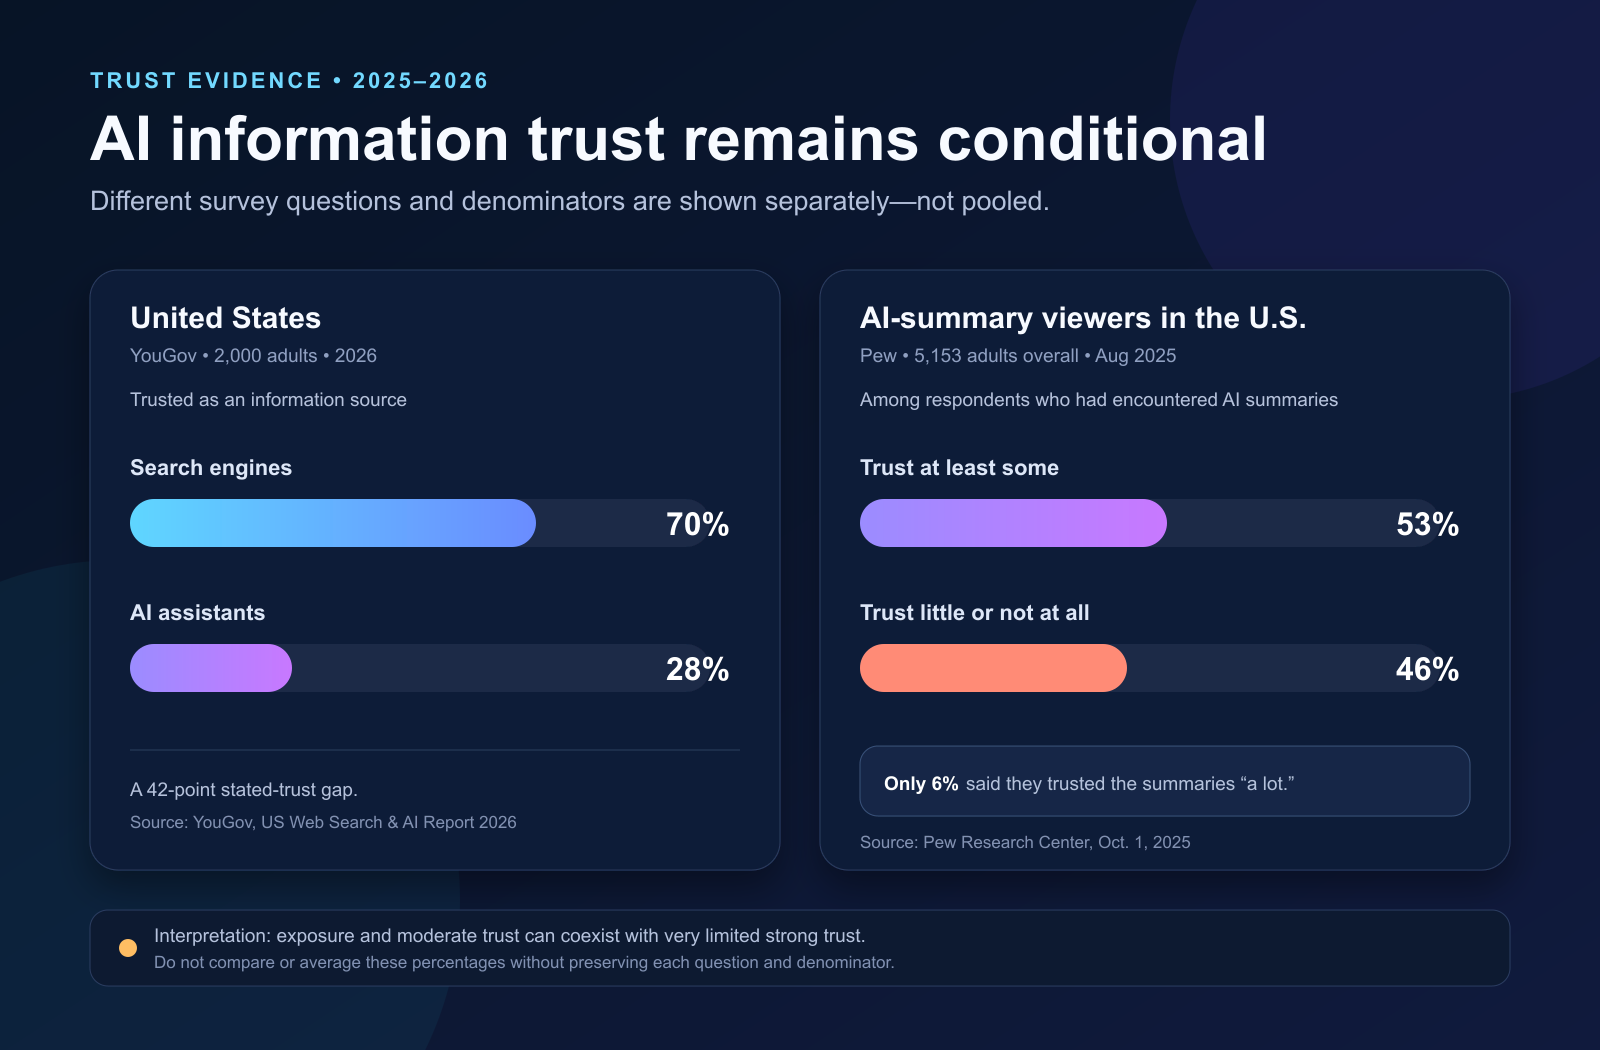
Pew’s August 2025 American Trends Panel adds an important denominator. Among 5,153 U.S. adults, 65% said they at least sometimes encountered AI summaries in search. Among those who had seen them, 53% trusted the information at least somewhat, but only 6% trusted it a lot; 46% trusted it little or not at all. Only 20% rated the summaries very or extremely useful, while 52% called them somewhat useful.4
The correct interpretation is not “people trust AI” or “people reject AI.” The distribution is ambivalent: widespread exposure, moderate utility, limited strong trust, and continued verification.
4. The trust–reliance gap is the central risk
The 2025 global study by Melbourne Business School and KPMG surveyed 48,340 people in 47 countries between November 2024 and January 2025. It found that 66% intentionally used AI regularly, while only 46% were willing to trust AI systems.5
The same report is frequently misquoted. Its finding that 66% relied on AI output without critically evaluating it applies to employees who used AI at work, not to all respondents or all consumers. Within that employee context, 56% reported making mistakes because of AI use and 72% reported putting less effort into their work. The narrower denominator makes the statistic more accurate, not less consequential: stated caution can coexist with operational reliance.
A preregistered experiment by Haiwen Li and Sinan Aral offers causal evidence about the source label itself. The researchers first audited 11,372 queries and 79,604 results across seven countries. They then randomized 4,927 U.S. adults to receive identical information labeled either as coming from generative AI or from traditional search. The generative-AI label reduced trust and willingness to share. Reference links increased trust and sharing, while uncertainty cues reduced them.6
Because the informational content was held constant, the trust penalty can be attributed to the label in that experimental setting. The study does not prove how every user behaves in the field, but it is stronger evidence than a preference survey alone.
5. AI answers change click behavior—and can obscure attribution
Pew’s browser panel observed 900 consenting U.S. adults and 68,879 unique Google searches in March 2025. AI summaries appeared in 12,593 of those searches. When a summary appeared, users clicked a traditional search result in 8% of visits; without a summary, they did so in 15%. A cited source inside the AI summary received a click in just 1% of visits. Sessions ended after 26% of visits with an AI summary, compared with 16% without one.7
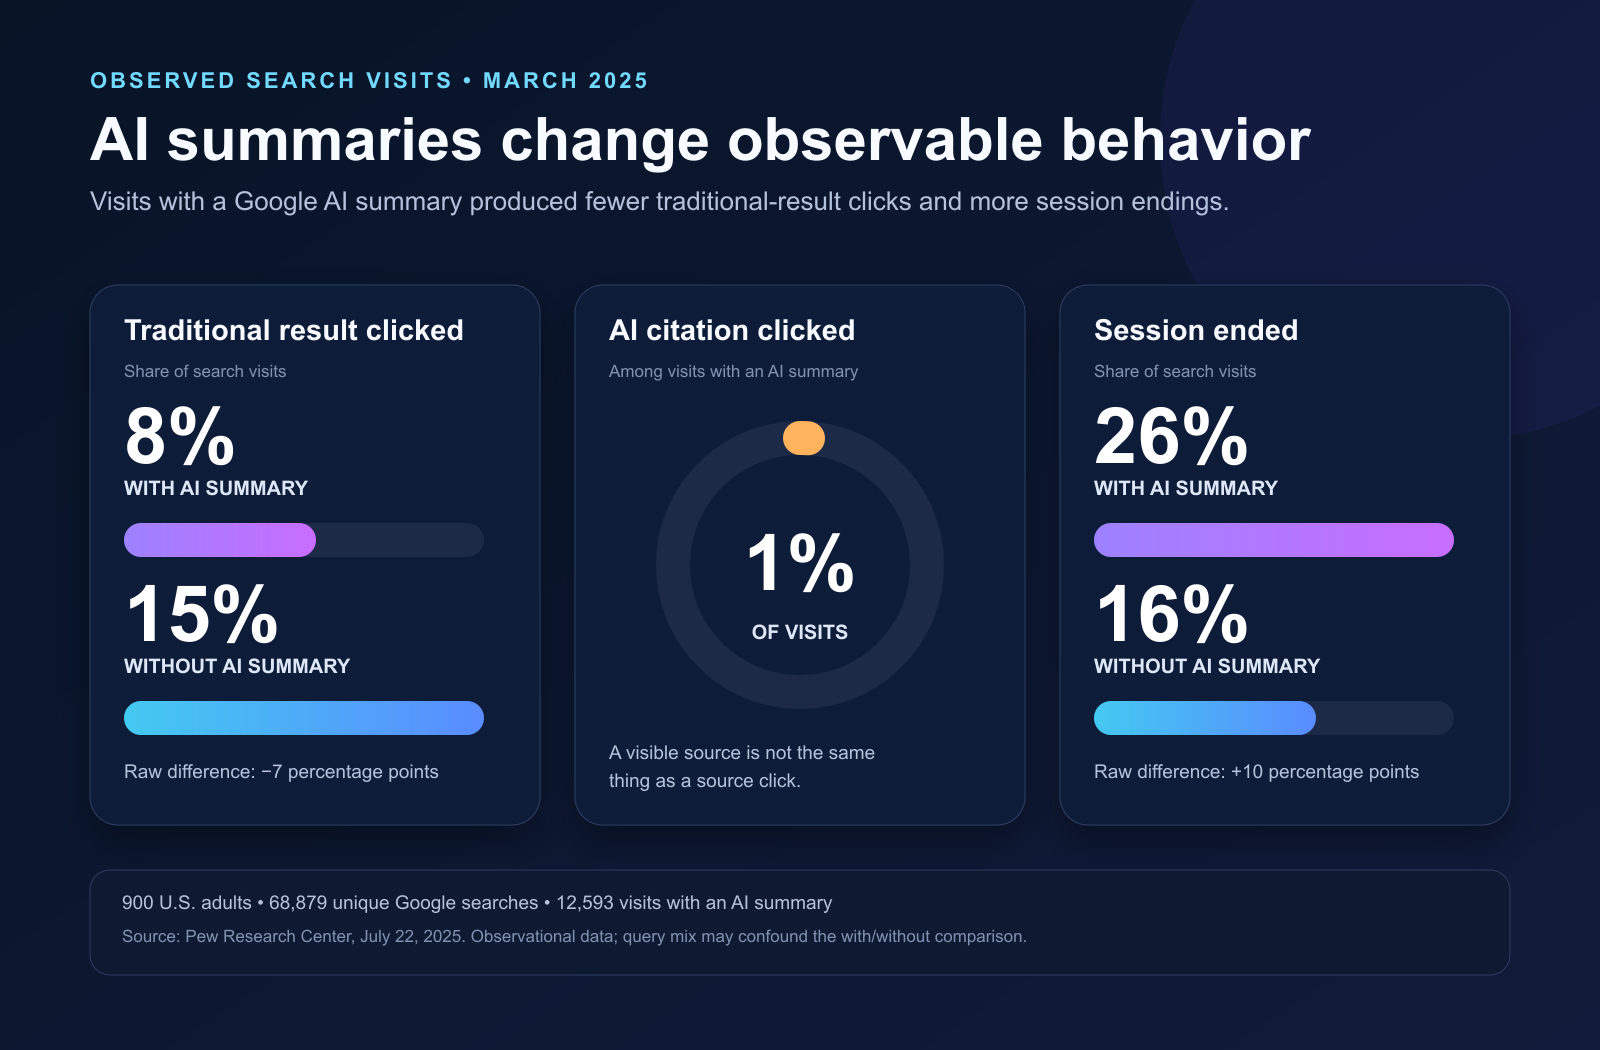
This study is observational. Query types that trigger AI summaries differ from those that do not, so the raw comparison should not be interpreted as a fully identified causal effect. It still demonstrates the analytics problem directly: AI-summary exposure and AI-citation clicks are not equivalent events.
Early causal evidence points in the same direction at the publisher level. A 2026 preprint used the staggered launch of AI Overviews and matched 161,382 Wikipedia article–language pairs. The authors estimated that AI Overview exposure reduced daily English-language Wikipedia traffic by approximately 15%, with substantial variation by topic.8 This is not a universal estimate for commercial websites, but it shows that an answer layer can absorb information demand that previously produced visits.
A testable attribution hypothesis
Unbranded AI question → brand recommendation → external verification → branded search or direct visit → conversion
The studies cited here do not directly estimate the conversion effect of this entire chain. It should therefore be treated as a testable attribution hypothesis, not as an established law. A brand can test it by aligning AI-mention time series with branded search demand, direct traffic, referral traffic, assisted conversions, and post-purchase survey responses. Temporal correlation alone is not proof of causation; controlled interventions or interrupted time-series designs provide stronger evidence.
6. Citations are trust signals, not truth certificates
AI citations perform three different functions that are easy to conflate:
- they can increase perceived credibility;
- they can offer a route to verification or a click;
- they may—or may not—support the claim beside them.
Li and Aral’s experiment found that reference links increased trust even when the references were invalid or hallucinated.6 A peer-reviewed AAAI 2025 experiment by Ding and colleagues, involving approximately 300 participants who evaluated answers under different citation conditions, also found that citations increased trust overall. Random citations reduced trust relative to valid citations; when participants checked those random citations, trust was not significantly different from the no-citation condition.9
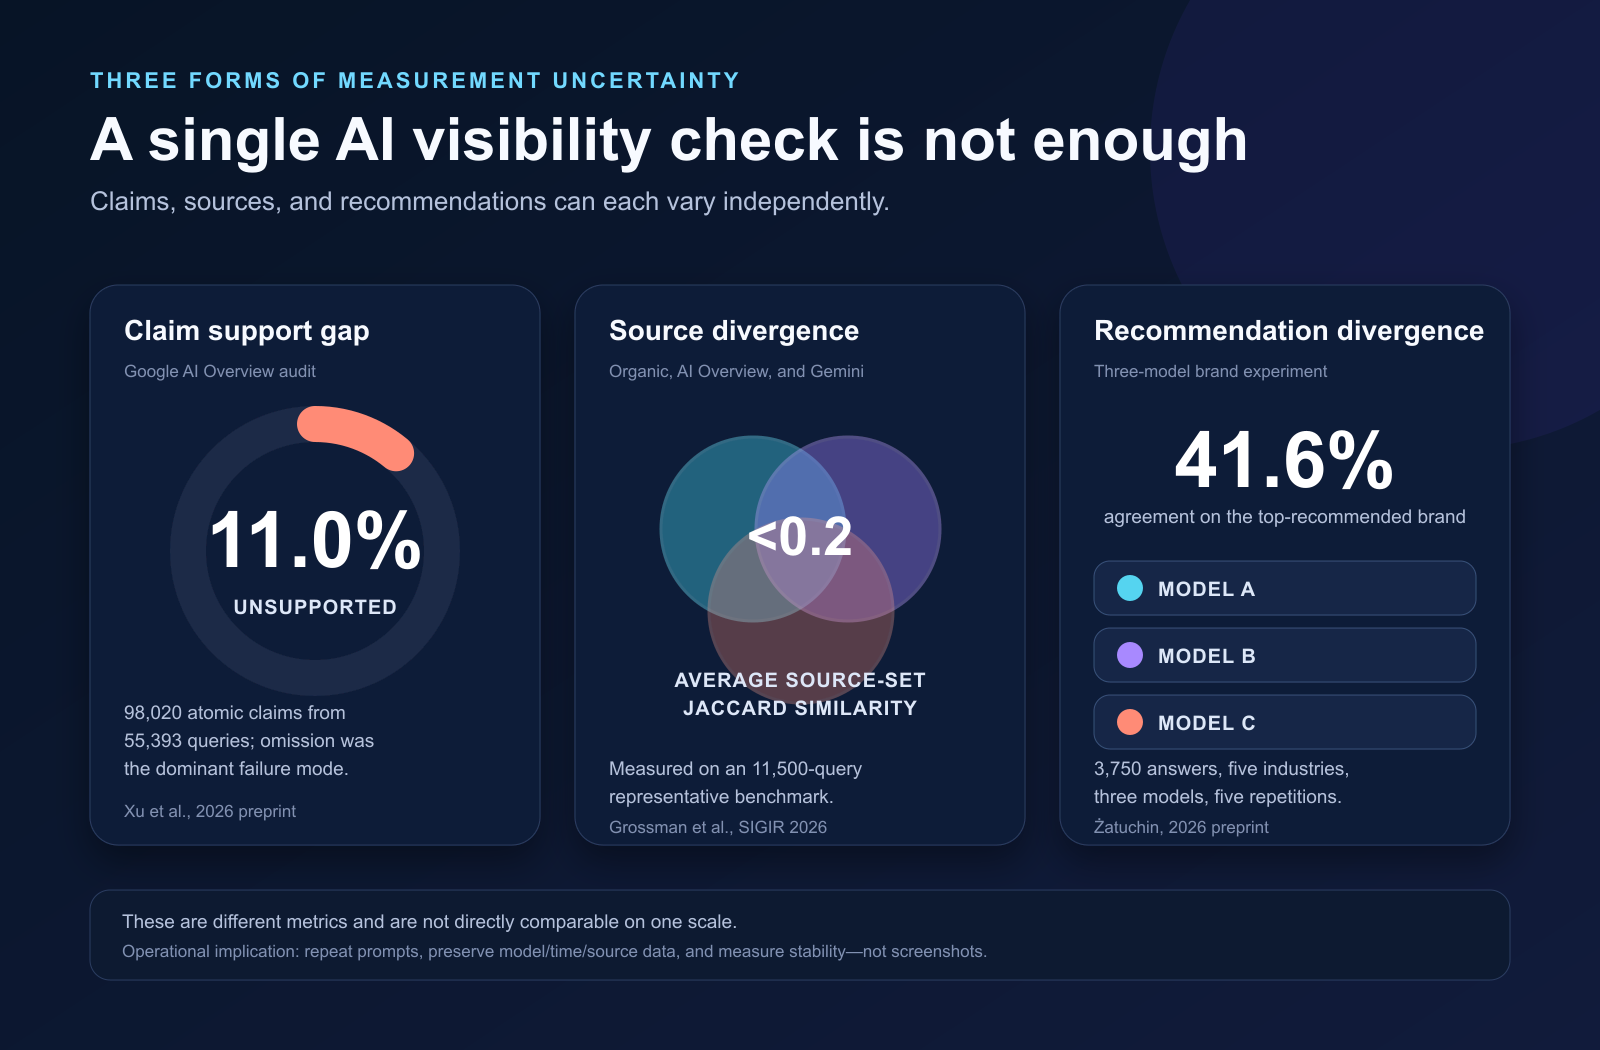
A large 2026 audit of Google AI Overviews decomposed 55,393 queries into 98,020 atomic claims. The authors reported that 11.0% of claims were unsupported by the cited pages, with omission—the cited page simply failing to establish the claim—the dominant failure mode.10 The work was a preprint at the time of this synthesis, so its estimate should be updated as the paper, product, and methodology evolve.
The Tow Center’s 2025 audit used 1,600 queries across eight generative search tools and 200 news articles. It documented incorrect attributions, fabricated links, and citations to syndicated or copied versions instead of the original reporting.11 Its news-retrieval design is narrower than general product discovery, but it confirms that a visible citation is not the same thing as faithful provenance.
For a brand, citation monitoring should therefore ask:
- Is the cited page owned, earned, competitive, or unrelated?
- Does it support the sentence or claim associated with the brand?
- Is the cited version canonical and current?
- Is an outdated third-party page defining the brand more strongly than the brand’s own evidence?
- Did the citation change before the mention changed?
7. AI source selection is not simply page-one SEO
Traditional search performance remains relevant, but it cannot be used as a complete proxy for answer-engine visibility. In the 2026 AI Overview audit, nearly 30% of cited domains did not appear on the first page of organic results for the same queries.10 Grossman and colleagues compared Google organic results, AI Overviews, and Gemini Flash 2.5 on an 11,500-query benchmark representative of real search use. Average pairwise Jaccard similarity between source sets was below 0.2, indicating that the systems frequently drew from substantially different pools of sources.12
An industry study by Muck Rack classified more than 25 million citation links collected from ChatGPT, Claude, and Gemini across 17 industries and unbranded top-of-funnel prompts. In its May 2026 edition, 84% of citations were classified as earned media, 27% as journalism, and 0.3% as paid or advertorial content.13 Journalism was a subset of earned media, so those percentages must not be added. The study is vendor-produced, uses a proprietary prompt and classification pipeline, and does not establish that earned coverage causes recommendation.
The implication is broader than “do more SEO.” Brands need to observe the source network from which answer engines construct their representations: product documentation, independent reviews, journalism, community discussions, marketplaces, structured databases, and outdated or syndicated pages. If an answer engine repeatedly cites a third party for a core product fact, that page has become part of the brand’s effective information supply chain.
8. One prompt, one engine, and one run are not measurement
Generative answers are samples from changing systems. Output can vary because of model updates, retrieval indexes, query phrasing, session context, localization, personalization, safety rules, and sampling.
The accepted SIGIR 2026 paper by Grossman and colleagues found that AI Overviews were less consistent across two runs and less robust to small query variations than organic results. It also found lower retrieval rates for sites that blocked AI crawlers.12 A separate 2026 brand-recommendation preprint generated 3,750 answers across 50 brands, five industries, 250 category queries, and three models. The models agreed on the top-recommended brand only 41.6% of the time.14
A credible monitoring system must:
- rerun a stable, versioned prompt panel;
- repeat at least a subset of prompts to estimate within-engine variance;
- preserve engine, resolved model, locale, time, and settings;
- retain raw answers and citations for audit;
- separate changes in the brand from changes in the model or retrieval layer;
- report sample size and uncertainty next to every rate.
9. What brands should track now
| Layer | Core metrics | Question answered |
|---|---|---|
| Presence | Mention rate, prompt coverage, competitive share of mention, answer prominence | Where and how often does the brand enter the candidate set? |
| Representation | Recommendation role, attributes, comparisons, sentiment, claim freshness | What does the answer say about the brand? |
| Evidence | Cited domains, source ownership, claim support, canonical status, citation volatility | What appears to support the answer? |
| Outcomes | Branded search, qualified visits, assisted conversion, pipeline, revenue | What observable business behavior changed afterward? |
Every rate requires a denominator. “Mentioned in 60% of answers” is meaningful only if the reader knows which prompts, engines, dates, markets, and retry policy produced the result. Citation count alone is equally weak: one accurate, authoritative source can be more valuable than ten loosely related links.
10. A defensible measurement design
Build a versioned prompt panel
Start with real customer questions, not only prompts that name the brand. Stratify them by category discovery, problem diagnosis, capabilities, price and value, alternatives, reputation, location, and brand verification. Freeze the initial wording and assign each prompt an ID. New prompts create a new version; they should not silently alter the historical denominator.
Define entities before collection
Maintain an approved list of brand names, spelling variants, former names, product names, and ambiguous aliases. Track competitors with the same discipline. A common two-letter abbreviation should not be matched without contextual validation.
Sample the system, not the screenshot
Run each prompt independently across selected engines. Repeat a designed subset. Record both the requested and resolved model when an intermediary selects the actual model. Keep failures and refusals in the denominator under a declared rule rather than rerunning until a favorable answer appears.
Preserve evidence
Store the raw answer, citations, timestamps, prompt version, parser version, and derived flags. Derived metrics should be reproducible from the raw observation. Manual corrections should be additive and auditable rather than overwriting the source response.
Quantify uncertainty
For a mention rate p̂ = x/n, always report x and n. When repeated runs are nested within prompts, distinguish prompt coverage, run-level mention rate, and stability across repeats. These metrics answer different questions and should not be substituted for one another.
Separate readiness from observed visibility
Technical readiness—crawlability, structured data, clear entity information, and accessible documentation—is a property of the brand’s web presence. A live AI mention is an observation from a specific engine at a specific time. Readiness can influence visibility, but it is not proof of visibility. The two should appear in separate reports and be connected only through tested hypotheses.
11. From monitoring to diagnosis
Monitoring creates value when it explains a change, not when it merely records one. Suppose a brand’s weekly mention rate falls from 48% to 29%. Before declaring a visibility crisis, the analyst should ask:
- Did the prompt panel or denominator change?
- Did one engine or model account for the decline?
- Is the change larger than normal repeated-run variance?
- Did a citation source disappear, change, or become inaccessible?
- Did a competitor gain mentions on the same prompts?
- Did representation change even where presence remained stable?
- Did any downstream behavior move in the same period?
The most useful alerts are therefore not every mention change. They are events such as:
- a high-value prompt repeatedly loses the brand across multiple runs;
- a competitor becomes the dominant recommendation;
- a materially false product claim appears;
- a trusted citation is replaced by an outdated or low-quality page;
- a source page changes shortly before the answer changes;
- a model update produces a sustained break from the historical baseline.
12. A practical 90-day program
Days 1–30: establish the baseline
- Select the markets, engines, and customer intents that matter commercially.
- Create a versioned panel of 30–100 unbranded and branded questions.
- Register brand aliases and a small competitor set.
- Collect repeated observations and raw citations.
- Manually validate the highest-impact claims.
- Publish baseline mention, prominence, competitor, and citation metrics with denominators.
Days 31–60: diagnose sources and representation
- Classify citations as owned, earned, competitive, marketplace, or unknown.
- Audit whether cited pages support material brand claims.
- Identify prompts where competitors appear but the brand does not.
- Map recurring answer attributes to the underlying source pages.
- Repair inaccurate or unclear first-party information where appropriate.
Days 61–90: connect visibility to outcomes
- Align the observation timeline with branded search, direct traffic, AI referrals, and conversions.
- Add a post-conversion “how did you first hear about us?” field that includes AI assistants.
- Predefine an intervention, such as improving a source page or correcting a factual inconsistency.
- Monitor treated prompts against stable comparison prompts.
- Document whether visibility, representation, evidence, and outcome metrics moved together.
The goal is not to manufacture a causal story. It is to make the system sufficiently observable that causal tests become possible.
13. What the evidence does—and does not—justify
Supported by the current evidence
- AI-generated answers have material consumer reach.
- Users can remain skeptical while still relying on AI-mediated information.
- Search visits with AI summaries exhibit different click and stopping patterns.
- Reference links can increase trust without guaranteeing support.
- AI and organic systems can select substantially different sources.
- Repeated observations are necessary to estimate stability.
Not established by the current evidence
- AI assistants have replaced search as the dominant discovery channel.
- Every AI mention produces incremental traffic or revenue.
- A citation proves causation or fully supports the associated claim.
- One vendor dataset represents the entire AI information ecosystem.
- Improving technical readiness automatically produces a mention.
- Simultaneous increases in mentions and revenue prove causation.
This boundary is essential. Monitoring is justified by uncertainty and potential influence; it should not be sold as certainty.
14. Conclusion: start measuring before the channel becomes easy to attribute
The strongest case for tracking AI brand mentions is not that AI has already displaced the web. It is that AI answers now sit between questions and decisions while leaving incomplete traces in conventional analytics.
The 2025–2026 evidence describes a channel with four unusual properties:
- substantial reach but limited strong trust;
- behavioral influence that often occurs before a click;
- citations that can increase credibility without guaranteeing support;
- volatile source and recommendation patterns that differ from organic rank.
Waiting for perfect attribution would mean waiting until a material part of the discovery process has already become opaque. The rational response is disciplined observability: a stable prompt panel, repeated sampling, preserved raw answers, explicit denominators, source-level verification, and a clear separation between presence, representation, evidence, and outcomes.
Brands that begin now will build the historical baseline needed to distinguish a real shift from model noise. Brands that wait will still see traffic and sales data—but may not know which AI-mediated recommendations, omissions, or inaccuracies helped produce them.
Research method
This article is a structured evidence synthesis, not a formal systematic review or meta-analysis. Sources were selected because they directly measured AI-answer exposure, trust, behavioral response, citation effects, claim support, source selection, traffic displacement, or brand recommendation variance. Priority was given to primary reports, papers, datasets, and official methodology pages published in 2025 or 2026.
Evidence types were kept separate. Representative surveys describe reported attitudes and use; browser panels describe observed behavior but may retain confounding; randomized experiments support causal interpretation within their study setting; computational audits estimate system behavior within a defined query sample; preprints provide timely evidence but have not necessarily completed peer review; company and vendor studies require explicit definitional and commercial caveats. Percentages from different questions, populations, and denominators were not pooled.
Primary references
- Google. Alphabet Investor Presentation — June 2026. Company-reported product reach.
- YouGov. US Web Search & AI Report 2026. Survey of 2,000 U.S. adults.
- YouGov. AI assistants as an information source in Germany. n=1,005; part of a 19-market study.
- Pew Research Center. Americans have mixed feelings about AI summaries in search results. October 1, 2025.
- Gillespie, N., Lockey, S., Curtis, C., Pool, J., & Akbari, A. Trust, Attitudes and Use of Artificial Intelligence: A Global Study 2025. Melbourne Business School and KPMG.
- Li, H., & Aral, S. The Paradox of Trust and Information: How People Interface with Generative AI. arXiv:2504.06435, 2025.
- Pew Research Center. Google users are less likely to click on links when an AI summary appears. July 22, 2025.
- Khosravi, A., & Yoganarasimhan, H. The Impact of Generative AI Search Summaries on Online Content Consumption: Evidence from Wikipedia. arXiv:2602.18455, 2026 preprint.
- Ding, Y., et al. Seeing Is Believing? The Effect of Citation Quality on Trust in Large Language Models. AAAI 2025.
- Xu, Z., Iqbal, S., & Montgomery, A. Do I Trust It? Auditing Factuality and Source Credibility in Google AI Overviews. arXiv:2605.14021, 2026 preprint.
- Tow Center for Digital Journalism. We Compared Eight AI Search Engines. They’re All Bad at Citing News. Columbia Journalism Review, 2025.
- Grossman, S., et al. Generative Search Engines Are Less Reliable than Traditional Search. arXiv:2604.27790; accepted at SIGIR 2026.
- Muck Rack. What Is AI Reading? May 2026 and study methodology. Industry research.
- Żatuchin, A. How Large Language Models Recommend Brands. arXiv:2606.23057, 2026 preprint under review.