Your organic sessions are down. AI Overviews are up. The tempting move is to take a headline such as “clicks fall 40%,” apply it to every affected page, and present the result as lost revenue. That calculation is fast, alarming, and usually indefensible.
The best 2025–2026 evidence now supports a more useful conclusion. AI Overviews can reduce outbound clicks when they appear, and a randomized field experiment demonstrates a large causal effect in its study setting. But exposure is uneven, effect estimates measure different outcomes, and the strongest publisher study produces materially different percentages under different statistical models. Your actual business loss may be large, small, zero, or temporarily masked by new impressions. An industry average cannot tell you which.
The answer in one minute
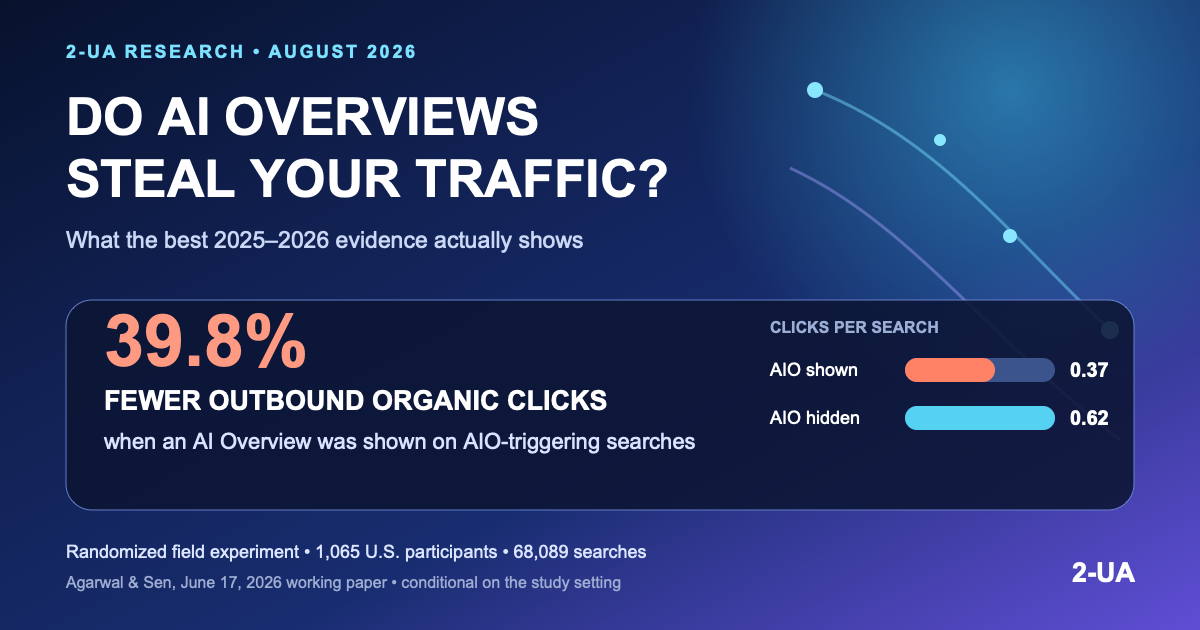
- Yes, substitution is real: a 2026 randomized field experiment found 39.8% fewer outbound organic clicks on searches that would trigger an AI Overview when the overview was shown.
- No, 39.8% is not your forecast: the estimate came from U.S. desktop Chrome users over two weeks and applies only to AIO-triggering searches in that experiment.
- Observed behavior points the same way: Pew found a result click in 8% of visits with an AIO versus 15% without one, but the comparison is observational.
- Publisher effects vary by model: a Wikipedia preprint’s preferred estimate is about −15%, while alternative proportional models estimate −3.5% and −8.1%.
- Your decision should use your denominator: combine generative-AI exposure, Search Console performance, Analytics outcomes, a control cohort, and a declared uncertainty range.
1. Start with the decision, not the scary percentage
A traffic-loss estimate is useful only if it changes a decision. A publisher may need to adjust its content economics. A SaaS team may need to protect high-intent comparison pages. An ecommerce company may care less about a lower click rate if qualified product visits and contribution margin remain stable. A small business may simply need enough evidence to decide whether a falling chart deserves engineering time or whether seasonality explains it.
Those decisions require three separate quantities:
- Exposure: how often your URLs appear in a generative result, in which countries, devices, page groups, and dates.
- Click displacement: how many visits would probably have occurred in a comparable world without the answer layer.
- Business impact: what the displaced visits would have contributed in leads, transactions, subscriptions, or gross profit.
Most public studies identify only one or two layers. Google’s new Search Console reporting improves exposure measurement. Browser panels and experiments estimate click behavior. Analytics connects visits to on-site outcomes. None of them, alone, gives a complete property-level counterfactual. The correct workflow is to keep the layers separate and then connect them with explicit assumptions.
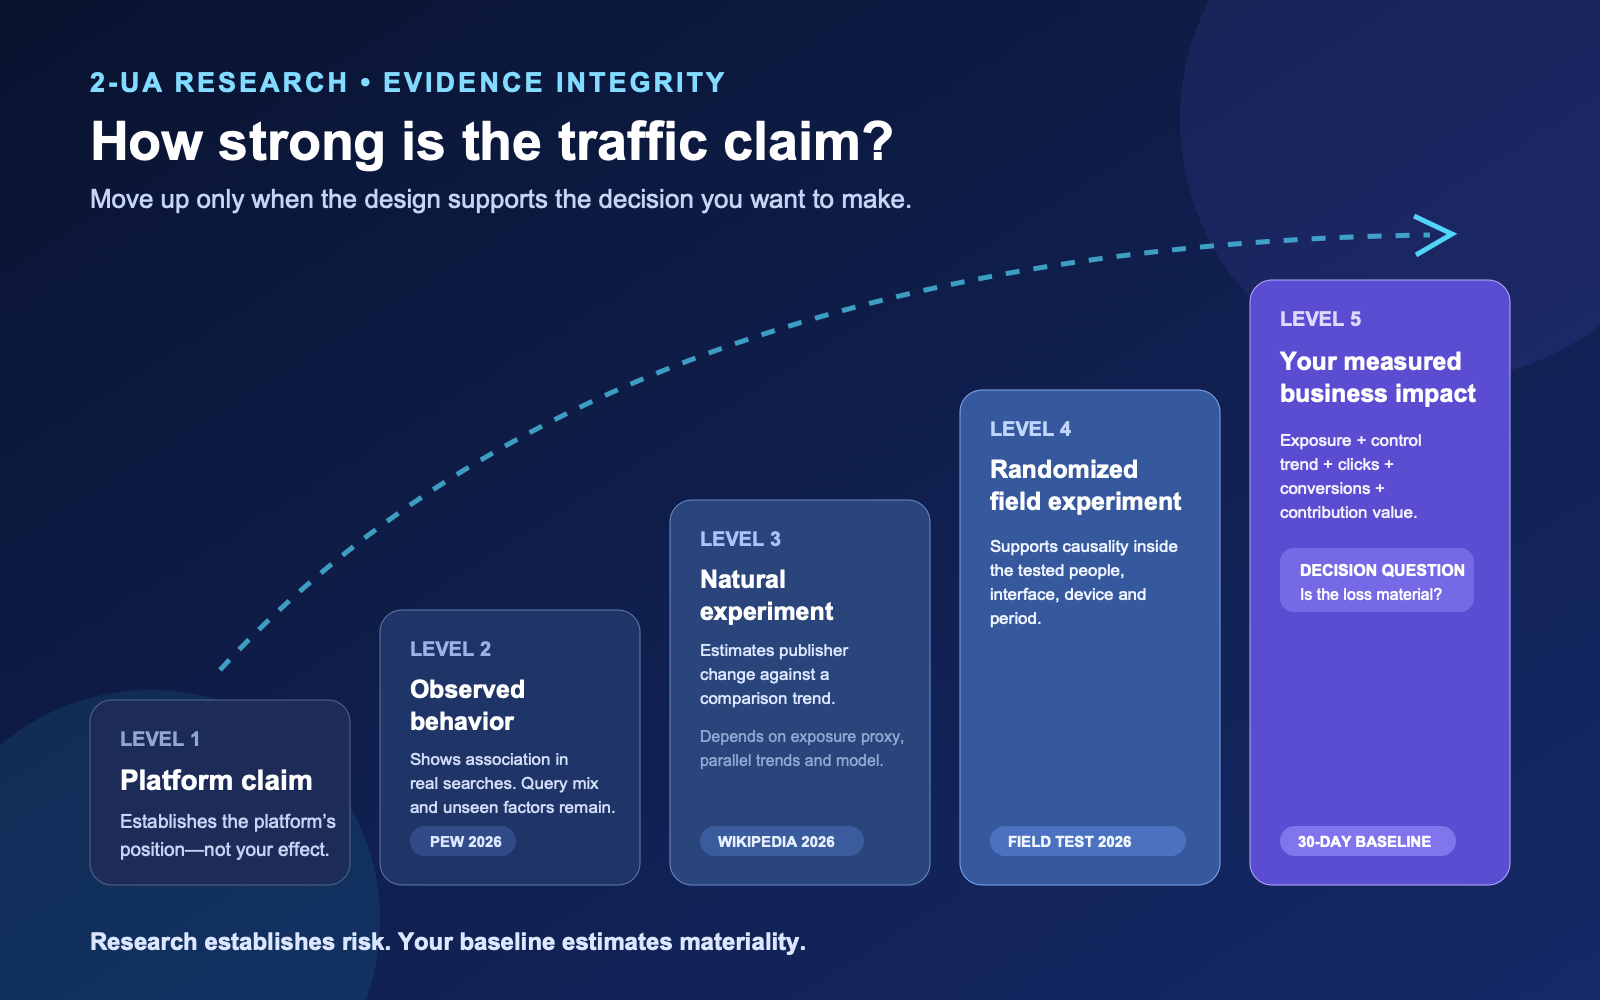
2. The evidence ladder: what each design can actually prove
Evidence about AI search is easy to flatten into one debate: Google says traffic quality is healthy; publishers say clicks are disappearing. That framing hides the research designs underneath the claims.
Platform reporting and platform claims
In June 2026, Google announced dedicated Search Generative AI performance reports in Search Console. The launch documentation lists impressions, pages, countries, devices, and date granularity for generative features in Search and Discover.1 This is valuable exposure data. It is not a lost-click report: the announcement does not list a query dimension, AI-feature clicks, CTR, conversions, or a no-AIO counterfactual.
Google has also said that aggregate organic click volume remained relatively stable year over year and that the clicks it classifies as high quality increased slightly. Google defines those as visits that do not quickly return to Search.4 Its technical guidance says AI-feature traffic is included in the general Web performance type and repeats the quality position without publishing a measurement method.3 That is a relevant counterposition, but the published claim has no disclosed sample, property distribution, exact comparison window, or reproducible method. Aggregate stability can coexist with severe losses for some sites and gains for others.
Observational browsing evidence
Observational panels show what people did in naturally occurring searches. They capture real behavior, but an AIO is not assigned randomly. Queries that trigger a summary tend to be longer, more question-like, and more informational. Those same attributes can affect clicking. Statistical adjustment helps, but it cannot guarantee that every important difference has been removed.
Natural experiments and randomized field experiments
A difference-in-differences study asks whether an earlier-exposed group changes relative to a comparison group that was exposed later. Its credibility depends on the counterfactual trend and the treatment proxy. A randomized experiment is stronger for causality because the study assigns the interface, but the result remains bounded by the participants, devices, period, and intervention it actually tested.
The final rung is not another external report. It is a documented measurement design on your own pages. External research establishes plausibility and suggests mechanisms. Your data estimates commercial materiality.
3. What Pew observed: a large association with an honest limitation
Pew Research Center’s updated 2026 paper analyzes one month of browsing from an address-based panel of 900 U.S. adults. From March 1–31, 2025, the participants generated 2,457,176 page visits, including 91,121 visits to Google Search pages and 68,879 distinct Google queries. AIOs appeared on 12,593 of those distinct searches, about 18%.5
The raw difference is striking. A traditional search-result link was the next action in 8% of visits containing an AIO and 15% of visits without one. Only 1% of AIO visits produced a click to one of the first three highlighted sources inside the overview. Users ended their browsing session after 26% of visits with an AIO versus 16% without one.
The formal paper improves on the original July 2025 short read. Its mixed-effects logistic models control for selected query attributes and participant-specific tendencies. The AIO association remains statistically significant: lower odds of clicking a result and higher odds of ending the session. That makes “the difference is only query length” an inadequate dismissal.
It still does not make the result causal. The researchers could not randomly turn AIOs on and off. They recollected result pages in April to classify March visits, matched only the first three sources highlighted in the overview, and modeled 647 panelists with usable observations. The 8% and 15% values are also visit-level probabilities of any result click. They are not Search Console CTR for a domain, a page, or a query. Applying the relative difference to your sessions would silently change the denominator.
4. The strongest causal evidence: what the 39.8% experiment means
The pivotal 2026 working paper by Saharsh Agarwal and Ananya Sen uses a custom Chrome extension to manipulate the search experience in the field. The study recruited 1,065 U.S.-based Prolific participants who reported Google as their primary search engine, used Chrome as their only browser, and passed minimum browsing-activity checks. Each participant contributed two weeks of desktop browsing between January 7 and February 10, 2026.6
Participants were randomly assigned to standard Google Search, a “Hide AIO” condition, or an exploratory AI Mode condition. For the main comparison, 396 control participants saw Google normally and 374 treatment participants had the AIO removed in real time. The organic results shifted upward to fill the removed space; all other page elements stayed in place. Across the full sample, the extension identified 68,089 unique searches, and an AIO would have appeared on about 41% of them.
On searches that would trigger an AIO, the mean number of outbound organic clicks was 0.37 when the overview remained visible and 0.62 when it was hidden. Expressed relative to the no-AIO counterfactual, showing the overview reduced outbound organic clicks by 39.8%. The probability of a zero-click search was 0.73 with the AIO and 0.54 when hidden, reported as a 34.5% increase. Sponsored clicks and overall search frequency did not measurably change.
The experiment also tests Google’s click-quality defense. Among successfully reconstructed downstream sessions, the authors found no meaningful difference in active time, bounce behavior, returning to Search, or pages viewed per external click. The remaining clicks were not detectably better on the study’s measures. That does not prove click quality never improves, but it is stronger counterevidence than a vendor CTR chart because the interface was randomized.
External validity is the honest boundary. Prolific participants are not a probability sample of all searchers. Mobile behavior is absent. The observation period is short. Hiding the overview also changes the vertical position of organic results, which is part of the real user experience but means the treatment combines answer removal with restored prominence. The paper is a preregistered working paper, not yet a peer-reviewed multi-country standard. It establishes causality inside the design, not a universal coefficient.
5. The Wikipedia result is important—and more model-sensitive than the headline
Khosravi and Yoganarasimhan use Wikipedia as a transparent publisher-level setting. Their preprint compares English articles, exposed earlier during the U.S. rollout, with the same underlying articles in Hindi, Indonesian, Japanese, and Portuguese editions that were exposed later. The panel contains 46,534,093 article-language-day observations: 161,382 matched article-language pairs and 52,262 English articles observed from October 28, 2023 through August 14, 2024.7
The preferred additive levels model estimates 220.5 fewer daily views per English article after early AIO exposure relative to the controls. The authors describe that as approximately a 15% decline. Weekly aggregation produces a similar 14.8% estimate. Topic patterns support the substitution mechanism: the reported percentage decline is largest for Culture (19.6%) and smallest for STEM (7.4%). A short synthesized answer may satisfy more cultural-reference queries than technical questions that invite deeper reading.
Here is the detail that should stop anyone from copying “15%” into a revenue forecast: alternative model specifications return smaller proportional effects. A Poisson pseudo-maximum-likelihood model estimates a 3.5% decline, while a traffic-weighted log model estimates 8.1%. Those estimators target different objects, and the direction remains negative, but the economic magnitude is not model-invariant.
Treatment is also a proxy. Wikimedia reports page views by language edition, not the reader’s country or the search result they saw. English Wikipedia has global traffic, and not every U.S. query showed an AIO during the gradual rollout. The design assumes that, without AIOs, English and the matched language editions would have continued on comparable trends after fixed effects. The authors run several robustness checks, but no observational natural experiment can observe that missing world directly.
Wikipedia is both highly informational and heavily cited. That makes it a plausible substitution target but a weak template for an ecommerce product page, local service, SaaS comparison, or branded navigational query. The study proves that publisher-level displacement can be economically meaningful. It does not provide an industry conversion factor.
6. How the studies fit together without becoming a fake meta-analysis
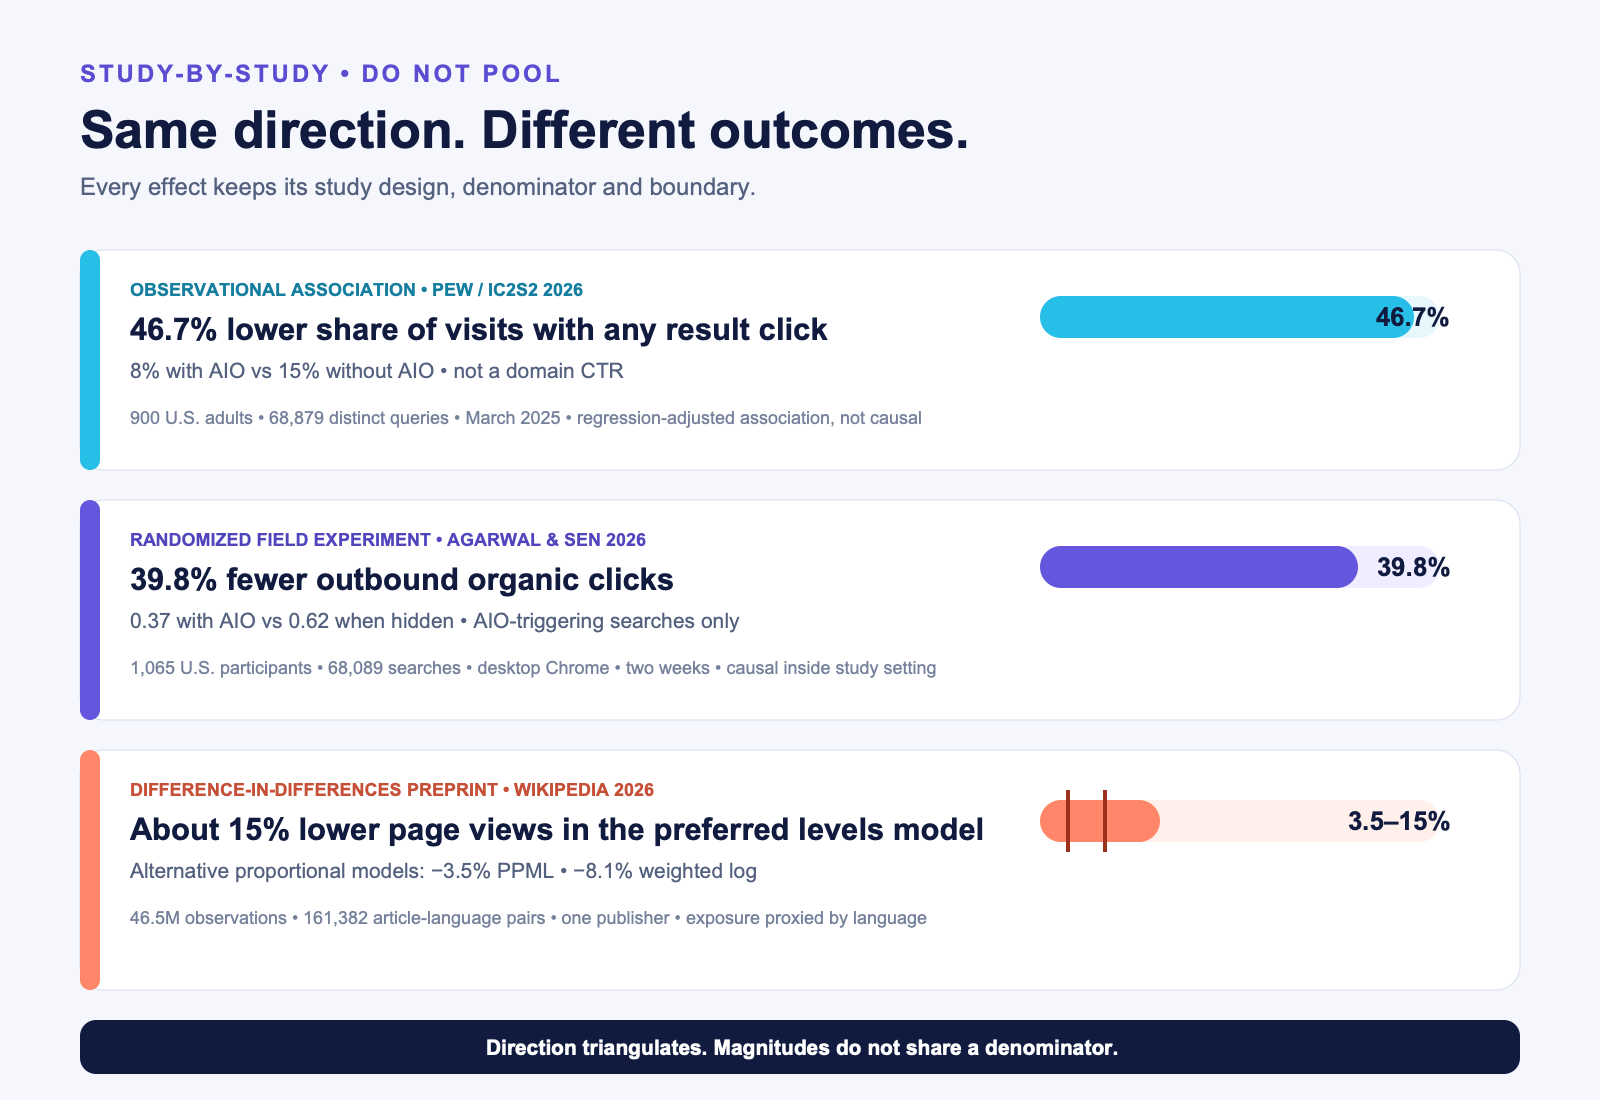
The three pivotal studies triangulate a mechanism. When a search interface supplies a synthesized answer before traditional links, fewer outbound visits are plausible. Pew observes the behavior. The field experiment manipulates the interface and identifies a causal click effect. Wikipedia detects a publisher-level traffic shift during rollout.
Triangulation is not pooling. The outcomes are different:
- Pew: whether a visit’s next action was any result click.
- Agarwal and Sen: the count of outbound organic clicks per search under random assignment.
- Wikipedia: daily page views for one publisher relative to language-edition controls.
A pooled average would imply that these are noisy measurements of the same quantity. They are not. It would also give a false sense of precision while hiding product versions, activation rates, countries, device coverage, query intent, ranking distribution, and site model. The responsible synthesis is directional: meaningful click displacement exists; its size depends on exposure, placement, intent, and site.
7. The strongest counterargument: maybe AI creates more searches and better visits
Google’s best counterposition is not that individual clicks never disappear. It is that AI features expand the number and complexity of questions, expose a wider set of links, and send fewer but more engaged visitors. If total high-quality traffic grows, a lower per-query click rate could coexist with a healthy web ecosystem.
Parts of that argument are plausible. A user who receives an adequate overview may avoid a low-intent visit; another user may discover a page through a query they would never have attempted before. Google’s dedicated generative-AI impressions can reveal new exposure. A commercial site should prefer profitable visits to empty page views. The field experiment also observed no reduction in search frequency when AIOs were hidden, but two weeks among selected desktop users cannot settle long-term query expansion.
The current public evidence does not validate Google’s aggregate quality claim at property level. Google has not published the denominator, site distribution, uncertainty, or counterfactual behind it. The randomized experiment found no detectable downstream-quality improvement on its measures, and the strongest observational and publisher studies show fewer visits. The fair conclusion is conditional: query expansion and traffic redistribution may benefit some sites, while answer substitution harms others. Measure qualified outcomes instead of choosing a universal narrative.
8. What the evidence does not show
Seven claims you still cannot make
- “AI Overviews caused my entire organic decline.” Rankings, demand, query mix, competitors, seasonality, and site changes remain alternatives.
- “Every generative-AI impression costs a click.” An impression is exposure, not a lost visit.
- “The correct loss rate is 39.8%.” That is one experiment’s conditional causal estimate.
- “Pew proves causation.” Its regression-adjusted association is not random assignment.
- “Wikipedia proves commercial sites lose 15%.” It is one unusual publisher, and model choices produce 3.5%–15% estimates.
- “Search Console clicks should equal Analytics sessions.” Google explicitly documents why the measures differ.
- “Lower traffic means lower profit.” Conversion rate, order value, lead quality, retention, and margins determine the business result.
These limits do not make the research useless. They tell you what the next measurement must supply: exposure by segment, a comparison trend, post-click outcomes, and uncertainty. If the evidence cannot identify a site-specific causal effect, label the result a defensible scenario estimate rather than manufacturing certainty.
9. The exposure-to-revenue measurement funnel
Google’s tools divide the journey at the click. Search Console measures activity before a person reaches your website. Analytics measures sessions and behavior after arrival. Google warns that clicks and sessions are calculated differently and will not match exactly; consistent trends matter more than forced equality.2
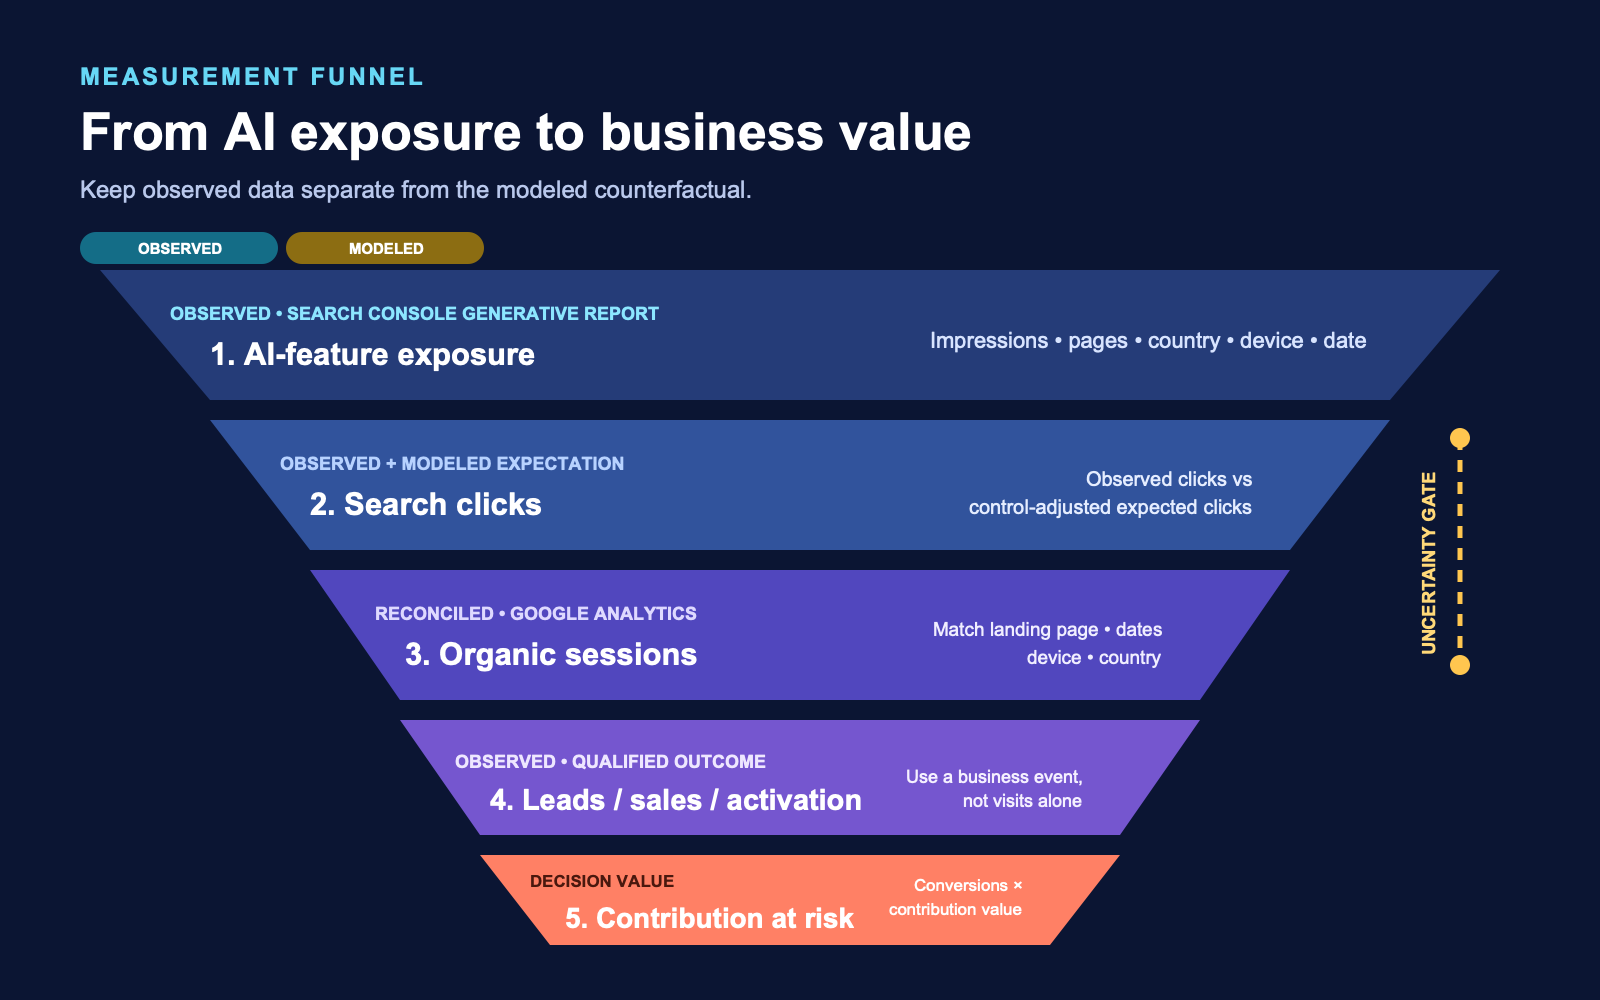
Build the funnel in five layers:
- Generative exposure: AI-feature impressions by URL, country, device, and date.
- Search performance: Search Console impressions, clicks, CTR, and position for the same page group and period.
- On-site arrival: Analytics sessions and engaged sessions from Google organic, reconciled by landing page and segment.
- Commercial action: qualified lead, checkout, subscription, trial activation, or another outcome tied to value.
- Contribution: gross profit or expected lead value, not top-line revenue alone.
The first, second, fourth, and fifth values may be observed. “Clicks that would have occurred without the AIO” is modeled. Visually and numerically distinguish observed values from expected values. That one convention prevents a scenario estimate from hardening into a fact as it moves through a presentation.
10. Build a 30-day baseline before diagnosing loss
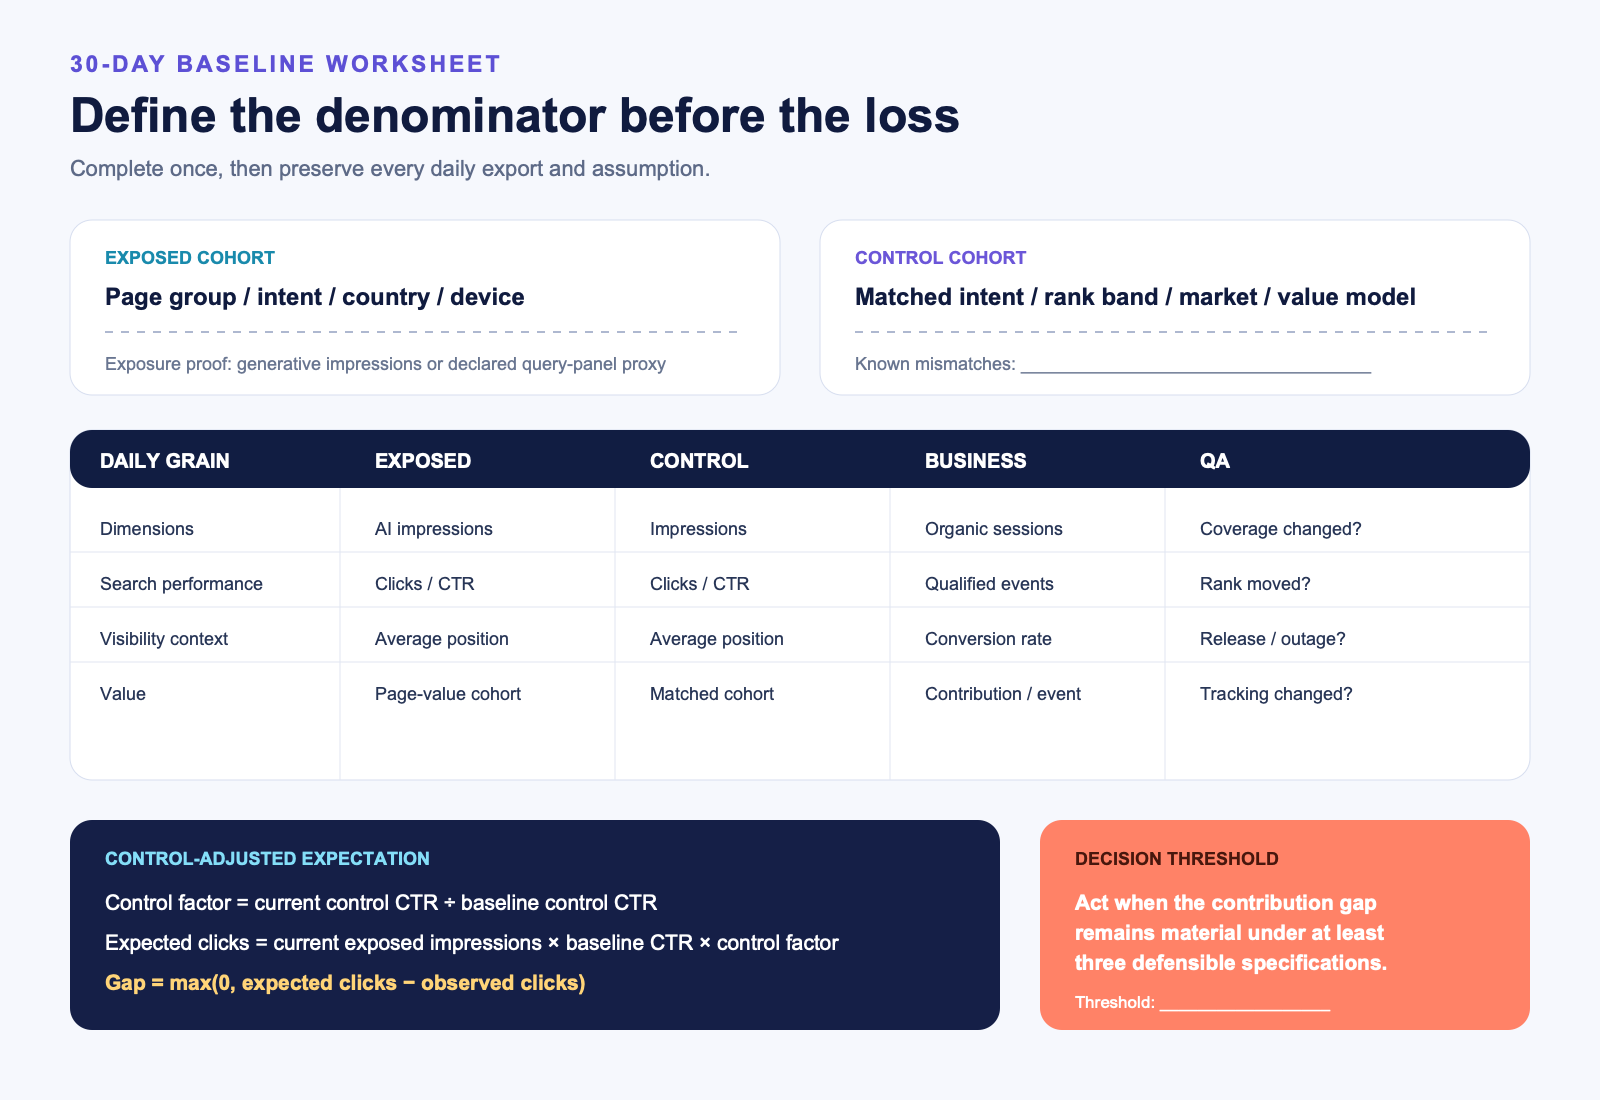
A baseline should be a versioned table, not a screenshot. Start with at least two page cohorts:
- Exposed cohort: pages receiving generative-AI impressions or pages whose query class reliably triggers AIOs.
- Control cohort: comparable pages with similar intent, ranking band, device mix, country mix, and business model but little or no measured generative exposure.
Perfect controls rarely exist. Record the mismatches. A category page cannot control for an editorial explainer merely because both rank in position four. If exposure reporting is not available for your property, use a declared monitoring panel of queries as an exposure proxy and label it accordingly. Do not infer AIO presence from a traffic drop alone.
Baseline fields
| Layer | Minimum fields | Why it matters |
|---|---|---|
| Segment | Page group, intent, country, device, date, ranking band | Prevents mix shifts from masquerading as AIO effects |
| Exposure | Generative impressions, exposed URLs, observation coverage | Defines the treatment proxy and its missingness |
| Search | Impressions, clicks, CTR, average position | Separates visibility from click-through change |
| Analytics | Organic sessions, engaged sessions, key events | Reconciles arrivals and post-click quality |
| Business | Qualified conversions, conversion rate, contribution value | Translates traffic scenarios into decision value |
| Context | Releases, migrations, campaigns, outages, SERP changes | Preserves alternative explanations |
11. A defensible loss estimate: formula and worked example
The simplest useful design is a control-adjusted CTR expectation. Calculate the exposed cohort’s baseline CTR, then adjust it by the change observed in the control cohort. This does not create random assignment; it makes the counterfactual visible and falsifiable.
control trend factor = current control CTR ÷ baseline control CTR
expected clicks = current exposed impressions × baseline exposed CTR × control trend factor
estimated click gap = max(0, expected clicks − observed exposed clicks)
Worked example
Suppose a group of exposed informational pages records 100,000 current impressions. Its baseline CTR was 4.0%. A matched control cohort’s CTR moved from 5.0% to 4.75%, creating a control trend factor of 0.95. Expected clicks without an exposed-cohort-specific shift are therefore:
100,000 × 0.040 × 0.95 = 3,800 expected clicks
If the exposed cohort received 2,800 clicks, the modeled click gap is 1,000. Now reconcile Search Console to Analytics for the same dates, device, country, and landing-page group. If you observe 0.90 organic sessions per Search Console click, the scenario implies 900 sessions. At a 2.0% qualified-conversion rate and $120 contribution value per conversion:
1,000 × 0.90 × 0.020 × $120 = $2,160 estimated contribution at risk
That is not “AI Overviews cost $2,160.” It is: “Under a control-adjusted CTR counterfactual, this cohort is 1,000 clicks below expectation, mapping to approximately $2,160 in contribution if historical reconciliation and conversion rates hold.” The longer sentence is better because it tells the decision-maker which assumptions can fail.
Segment before you estimate
A single sitewide coefficient is usually the wrong unit. Segment explanatory articles, definitions, comparisons, product pages, local pages, support documentation, and branded navigation before calculating a counterfactual. A 2026 computational audit of 55,393 trending queries found AIO activation ranging from 3.5% to 46.1% across its 19 topic categories, and question phrasing was strongly associated with activation. The authors explicitly did not measure traffic loss, so those percentages are not loss rates; they demonstrate that exposure itself is highly nonuniform.8
Ranking band matters for the same reason. A page moving from position two to position seven can lose clicks while AIO exposure rises, but the ranking change remains a competing cause. Separate stable-rank pages from moving-rank pages. Likewise, preserve device and country. The strongest randomized evidence is desktop-only, while mobile AIO layouts can hide or compress sources differently. Combining the two profiles may make a genuine mobile effect look moderate or make a desktop-only change appear universal.
Finally, segment by money. A glossary page funded by display advertising, a high-intent comparison that creates trials, and a support article that reduces service cost do not have the same value per visit. Give each cohort its own conversion definition and contribution value. If the business cannot state the value of the next qualified action, a revenue-loss estimate will only add precision to an undefined outcome.
Report a range, not a ceremonial decimal
Build conservative, base, and upper scenarios by changing assumptions you can defend: inclusion criteria for exposed pages, baseline window, control cohort, click-to-session reconciliation, and contribution rate. Do not create arbitrary ±20% bands. If all reasonable specifications produce a material loss, the decision is robust. If the sign or materiality changes easily, keep measuring.
12. The 30-day operating plan
Days 1–3: freeze the specification
- Choose the page groups and commercial outcomes before looking for the largest decline.
- Record device and country separately; never average desktop and mobile by convenience.
- Define the exposed and control cohorts, including known mismatches.
- Export the prior comparison window and annotate product releases, migrations, campaigns, and outages.
- Set a materiality threshold, such as contribution at risk exceeding the monthly cost of the response.
Days 4–14: collect without rewriting the hypothesis
- Capture generative-AI exposure, Search Console performance, and Analytics outcomes daily.
- Check whether reporting coverage changes during the window.
- Monitor average position and impression mix so a ranking loss is not relabeled as click displacement.
- Track qualified conversion and contribution, not sessions alone.
- Keep raw exports and calculation versions so every chart can be reproduced.
Days 15–30: estimate, challenge, and decide
- Run at least three defensible specifications: alternative baseline, control, and segment boundary.
- Exclude periods affected by known releases or outages and compare the result.
- Inspect pages where impressions rise while clicks fall; these often reveal redistribution rather than simple disappearance.
- Review whether conversion rate or contribution per visit changed enough to offset traffic loss.
- Write one paragraph explaining why the estimate may be wrong before presenting why it may be right.
13. What to do this week
- Export a clean benchmark. Save 90 days of Search Console page, country, device, impressions, clicks, CTR, and position data.
- Join commercial outcomes. Match Analytics landing-page sessions, qualified conversions, and contribution value at the same grain.
- Mark AI exposure. Use the dedicated Search Console report when available; otherwise maintain a documented query-panel proxy.
- Create cohorts. Group pages by intent and business model before comparing them.
- Annotate confounders. Record releases, ranking changes, seasonality, campaigns, outages, and tracking changes.
- Set the decision threshold. Define the loss that would justify content work, product changes, or a measurement investment.
If you need to establish whether your pages are technically visible to AI search systems before building the full baseline, run the free AI visibility audit. Treat readiness and observed exposure as separate measurements: a technically accessible page is not guaranteed to appear, and an appearance is not proof of incremental value.
14. What would justify changing course?
A measurement program should end in a rule. Continue normal SEO investment when impressions, qualified conversions, and contribution remain healthy even if raw CTR declines. Protect or redesign page groups when multiple reasonable counterfactuals show a material contribution gap, especially where AIO exposure rises and rankings remain stable. Increase experimentation when the result changes sign across specifications.
For an evidence-led intervention, choose a page cluster, improve something independently valuable—original data, clearer comparison logic, stronger first-party evidence, or a more useful tool—and retain a stable comparison cluster. Track visibility, clicks, qualified actions, and contribution separately. A simultaneous improvement is encouraging but still not causal proof unless the design supports it.
Small sites should not imitate enterprise instrumentation. A spreadsheet with 20 priority pages, two cohorts, four weekly exports, and one commercial outcome can be enough. Enterprises should use warehouse exports, versioned transformations, coverage monitoring, and predeclared tests. The principle is identical: spend on measurement in proportion to the decision at risk.
15. Editorial verdict: AI Overviews can steal clicks, but your loss must be measured
“Steal” is emotionally loaded, but the underlying substitution question now has a serious answer. In a randomized field setting, showing an AIO caused fewer outbound organic clicks on eligible searches. Observational browsing and a publisher-level natural experiment point in the same direction. The mechanism is no longer speculation.
The universal forecast remains unsupported. Activation varies by query and topic. Placement matters. Mobile and international behavior are underrepresented in the strongest experiment. Wikipedia’s magnitude changes with the model. Google’s aggregate claims lack the property-level detail needed to resolve individual outcomes. Commercial value can move differently from visits.
The practical response is not denial or panic. Build a 30-day baseline that distinguishes exposure, clicks, sessions, conversions, and contribution. Use a control trend. Preserve the discrepancy between Search Console and Analytics. Publish the assumptions next to the result. Then act when the estimate remains material under reasonable alternatives.
Industry averages can establish that risk exists. Only your denominator can tell you whether the risk is worth funding.
Research method
This article is a structured evidence synthesis, not a formal systematic review or meta-analysis. Research was refreshed on August 12, 2026. Every pivotal paper was reviewed from the full primary text. Sources were selected for direct relevance to exposure reporting, observed click behavior, causal click displacement, publisher traffic, or measurement reconciliation. Platform claims, observational research, randomized evidence, difference-in-differences estimates, and computational audits are labeled separately.
No cross-study average was calculated because the outcomes and denominators are not commensurable. Chart values were recalculated from the reported source values and preserved in the visual manifest. The separate claim-to-source ledger records sample, timeframe, geography, method, denominator, supporting location, and material limitation for every consequential claim.
Primary references
- Google Search Central. Introducing Search Generative AI performance reports in Search Console. June 3, 2026.
- Google Search Central. Using Search Console and Google Analytics data for SEO.
- Google Search Central. AI features and your website. Updated December 10, 2025.
- Reid, L. AI in Search is driving more queries and higher quality clicks. Google, August 6, 2025.
- Chapekis, A., Lieb, A., Shah, S., & Smith, A. Investigating Click Behaviors On Google Search Result Pages That Produce an AI Overview. IC2S2 2026 extended paper.
- Agarwal, S., & Sen, A. The Impact of Google AI Overviews on Publisher Traffic and User Experience: Evidence from a Field Experiment. June 17, 2026 working paper.
- Khosravi, M., & Yoganarasimhan, H. Impact of AI Search Summaries on Website Traffic: Evidence from Google AI Overviews and Wikipedia. arXiv:2602.18455 v4, May 13, 2026 preprint.
- Xu, H., Iqbal, U., & Montgomery, J. M. Measuring Google AI Overviews: Activation, Source Quality, Claim Fidelity, and Publisher Impact. arXiv:2605.14021, May 2026 preprint.