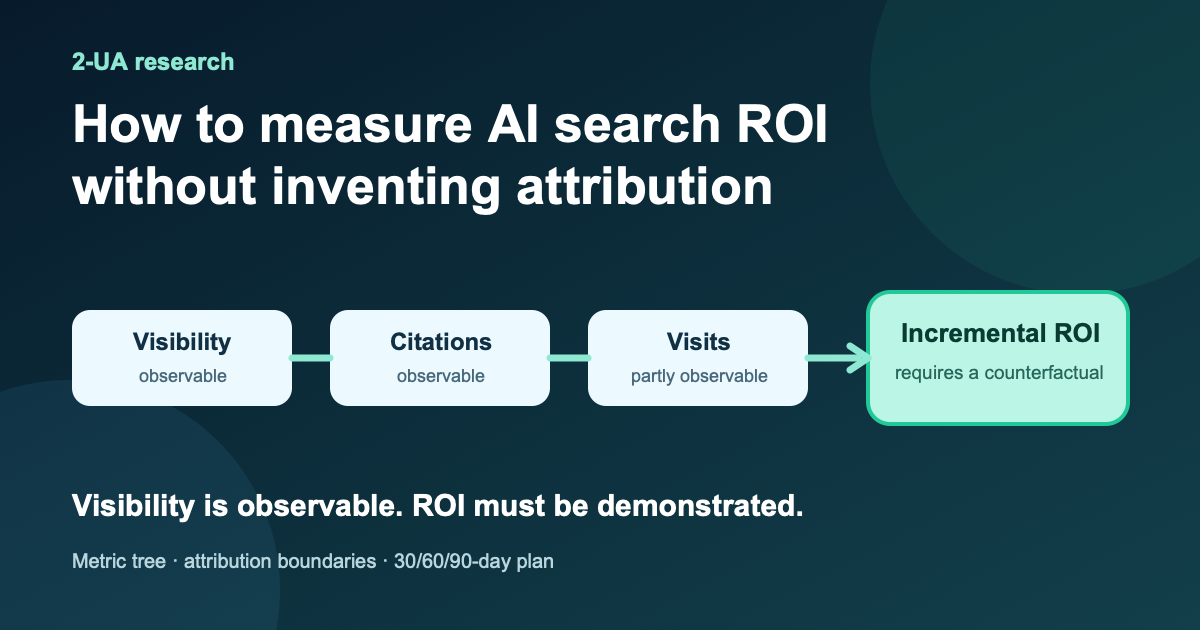
Your dashboard says AI search produced $72,000 in revenue. Finance approves another quarter of content, technical work, and monitoring. Then someone asks the question the dashboard cannot answer: how many of those customers would have bought anyway after using organic search, email, direct navigation, a salesperson, or the brand they already knew?
The number is not necessarily wrong. It may be a correct total for sessions that arrived from a recognizable AI referrer and later converted. It becomes wrong when the label silently changes from revenue observed on a path to revenue caused by AI-search work. That leap invents attribution. It treats a route into the site as the reason the customer exists.
AI search makes the problem harder because important behavior happens before a click. A person may see a cited brand, ask follow-up questions, return through a conventional search, and convert days later. Some AI interfaces expose links; some visits retain a recognizable referrer; some do not. Google and Bing now expose useful visibility data, but neither report closes the loop from appearance to incremental profit. A credible ROI system must therefore preserve what each instrument observes, admit what it misses, and use a separate design for causal claims.
Start with two questions, not one ROI number
The first question is descriptive: where did AI-search exposure or traffic appear along journeys that ended in a business outcome? Search Console, Bing Webmaster Tools, analytics, CRM data, and revenue systems help answer parts of it. The output is an attributed or associated value. It is useful for diagnosis, audience understanding, and deciding where to investigate.
The second question is causal: what changed because we made this investment? Answering it requires a counterfactual—the outcome for the same eligible opportunity without the treatment. Randomized holdouts are the cleanest route when they are feasible. Matched geographies, staggered rollouts, and calibrated time-series models can narrow the question when randomization is impractical, but their assumptions and uncertainty must remain visible.
These questions are complementary. Attribution gives operational detail that a broad experiment may not: which landing pages appear, which messages precede qualified leads, and which topics correlate with pipeline. Incrementality gives attribution an external check. If they disagree, do not average them into a comforting midpoint. Investigate substitution, selection, missing referrers, spillover, timing, and model assumptions.
Build a visibility-to-value metric tree
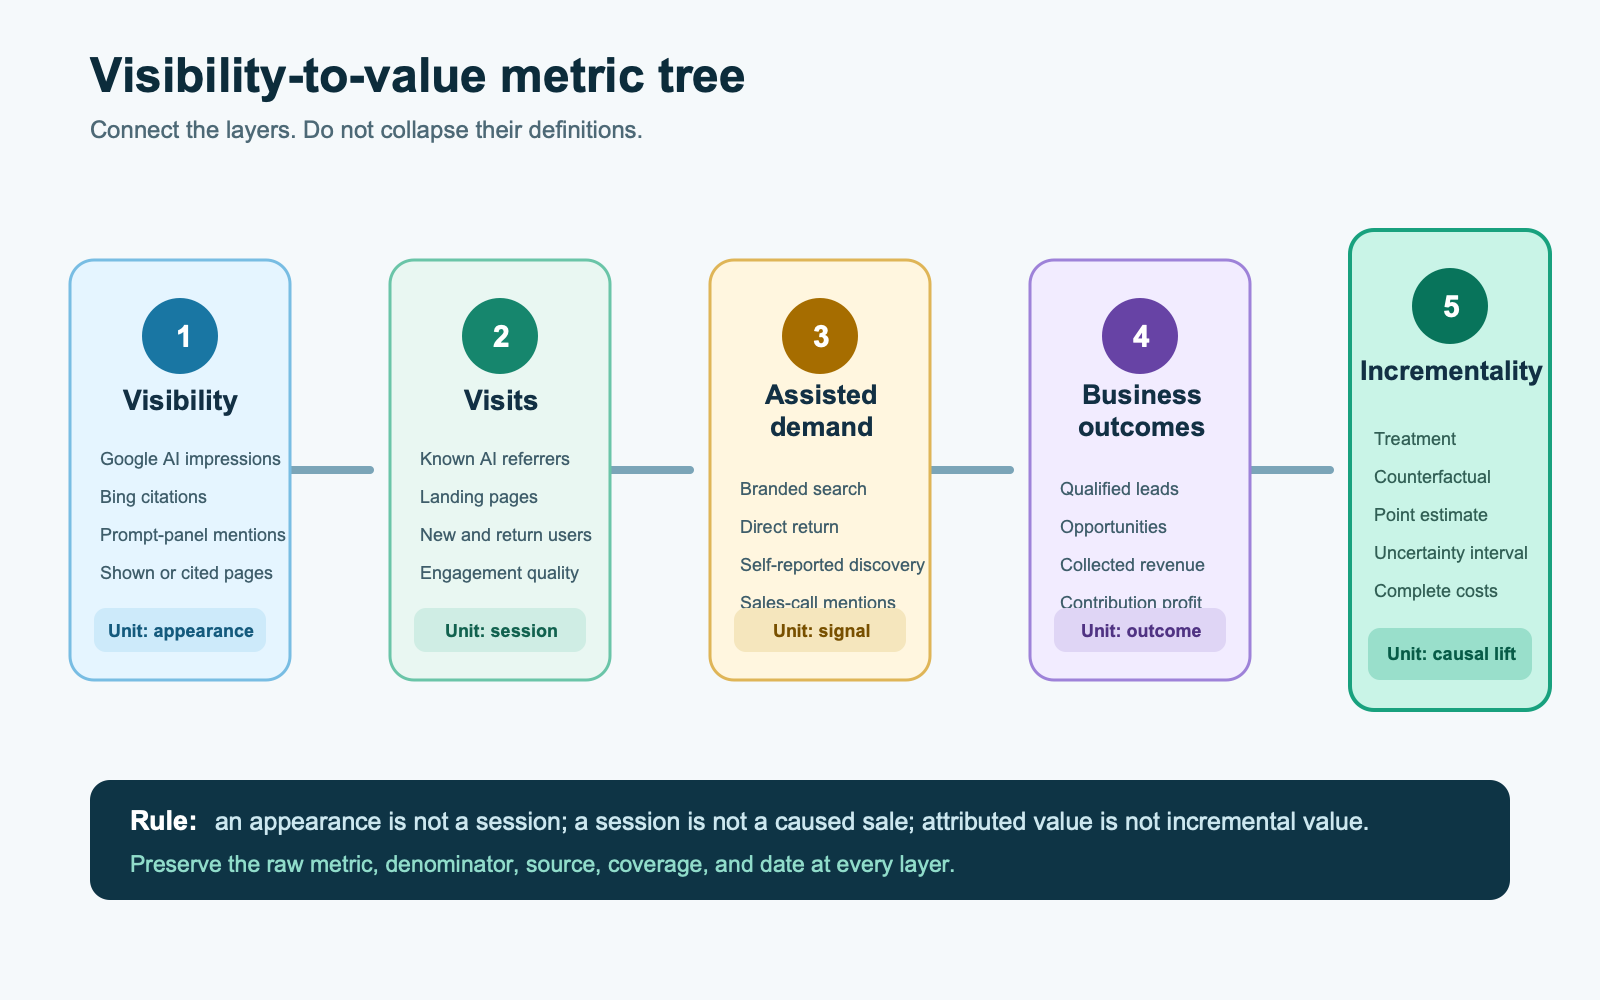
A useful measurement system does not force every signal into one denominator. It keeps five layers connected while preserving their distinct units.
- Visibility: appearances, impressions, cited pages, citation events, prompt-panel mentions, and share of observed answers.
- Visits: identifiable AI-referred sessions, landing pages, new users, engagement, and return behavior.
- Assisted demand: branded search, direct return, self-reported discovery, sales mentions, and journeys containing an AI touchpoint.
- Business outcomes: qualified leads, opportunities, orders, retained gross profit, and customer lifetime value under a documented window.
- Incrementality: the estimated difference between treated and counterfactual outcomes, with an interval and explicit assumptions.
A visibility rate needs a visibility denominator, such as observed AI-feature impressions or a documented prompt panel. A referral conversion rate uses referred sessions. A lead-to-opportunity rate uses qualified leads. ROI uses incremental economic value and total incremental cost. Changing the denominator halfway through a funnel is a common way to manufacture improvement.
Store the raw measures before creating composite scores. An executive score can be convenient, but it hides whether movement came from more appearances, a tracking change, higher-intent traffic, a pricing change, or a real lift in demand. The raw series also lets you restate history when a platform changes a definition without pretending the old and new numbers are identical.
Know exactly what the platform reports observe
Google introduced a dedicated Search Generative AI performance report in June 2026 and noted that it had rolled out worldwide by August 31. The report covers impressions from AI Overviews and AI Mode. It groups data by page, country, date, and device; chart totals are property-aggregated, page tables are page-aggregated, dates use Pacific Time, and the usual Search Console row and reporting limits apply.1
This is meaningful visibility data, but the current report is deliberately narrow. It tells you how often links to your site were shown in supported generative AI features. It does not expose a query dimension, clicks, conversions, revenue, answer placement, the text that used the source, or a counterfactual. Treat its impressions as a top-of-funnel observation—not as visits, citations, or value.
Bing’s AI Performance public preview exposes a different instrument across Microsoft Copilot, AI-generated Bing summaries, and selected partner integrations. It reports total citations, average cited pages per day, page-level citation activity, trends, and sampled grounding-query phrases. Microsoft explicitly says citation totals do not indicate placement, page importance, authority, or ranking, and that grounding queries represent a sample of activity.2 A citation event is therefore evidence that a URL was displayed as a source on a covered surface, not evidence that a reader noticed it or that it caused demand.
Keep Google impressions and Bing citations in separate columns. They have different event definitions, aggregation, surface coverage, and available dimensions. Summing them into “AI visibility” creates a number with no stable meaning. If leadership needs one view, show the two series side by side with definition notes and a coverage-change annotation.
Reconcile instruments before interpreting movement
Search Console measures behavior before arrival; analytics measures behavior after a tagged page loads. Google’s own reconciliation guidance warns that Search Console clicks and Analytics sessions are calculated differently and will not match exactly. Consent choices, missing tags, timezone differences, canonicalization, attribution settings, and other implementation details can widen the gap. Google recommends comparing trends and investigating large discrepancies rather than forcing totals to reconcile.3
Apply the same discipline to AI-search measurement. Maintain a source dictionary with the hostname patterns currently classified as AI referrals, the date each pattern was added, and whether the session source is supplied by the platform, browser, analytics classifier, or your own rule. Preserve the raw source and medium. Do not retroactively overwrite them with a broad “AI” channel unless you can rebuild the classification reproducibly.
Join at the safest common grain. Page and day are often available, but a page-day join can imply a relationship that the platforms did not report. Prefer weekly page or topic-cluster cohorts when volumes are small, record the timezone conversion, and keep unmatched records. A failed join is a measurement fact; deleting it makes the funnel look more complete than it is.
Add qualitative collection without pretending it is census data. A post-conversion question such as “Where did you first hear about us?” can surface journeys that return through direct or branded search. Keep the exact response options, allow free text, and report response rate. Sales-call notes can be coded with the same taxonomy, but a missing mention must not be treated as proof of no AI influence.
Referral conversion is not causal ROI
A peer-reviewed 2026 Marketing Science study provides the clearest recent warning against benchmark shopping. Kaiser and Schulze analyzed 12 months of first-party Google Analytics data from 973 ecommerce websites: about 10.5 billion sessions, $20.6 billion in revenue, 164.9 million transactions, 4.9 million ChatGPT-referred sessions, and 50,251 ChatGPT-referred transactions. In its adjusted six-month comparison, ChatGPT referral traffic had a higher conversion likelihood and revenue per session than paid social, but lower values than every other traditional channel in the study. Organic search had a 13% higher adjusted conversion likelihood than ChatGPT referrals.7
That result conflicts with many vendor headlines claiming that AI traffic converts several times better than organic search. The study does not prove the opposite as a universal rule. Its traffic was ecommerce traffic recorded from July 2024 to August 2025, ChatGPT supplied more than 90% of the observed LLM sessions, and product category mattered. The authors explicitly classify every analysis as descriptive rather than causal. They also state that the channel assignment relied on last click, which can understate upper-funnel contribution and remains vulnerable to differences in who uses each channel and when.7
The correct decision is not “AI traffic converts poorly” or “AI traffic converts brilliantly.” It is “external conversion benchmarks are not your counterfactual.” Use them to challenge assumptions and plan sample sizes. Use your own revenue, margin, qualification rules, customer mix, and costs for decisions.
Attribution and incrementality answer different questions
Google Analytics defines attribution as assigning credit for important actions to ads, clicks, and other factors on a customer’s path. Its models can allocate credit differently: paid-and-organic last click gives all credit to the last eligible channel, while data-driven attribution distributes credit using modeled path information. Direct visits are generally excluded from credit unless the path contains only direct visits, and conversions may be reattributed after they occur.4
A fractional credit is not automatically a causal estimate for an organic AI-search program. It describes a model’s allocation among recorded touchpoints. A customer already predisposed to buy may both seek an AI recommendation and convert. A valuable citation may create demand but leave no identifiable visit. A new product launch may raise both AI mentions and sales. Without a counterfactual, path data cannot separate these stories.
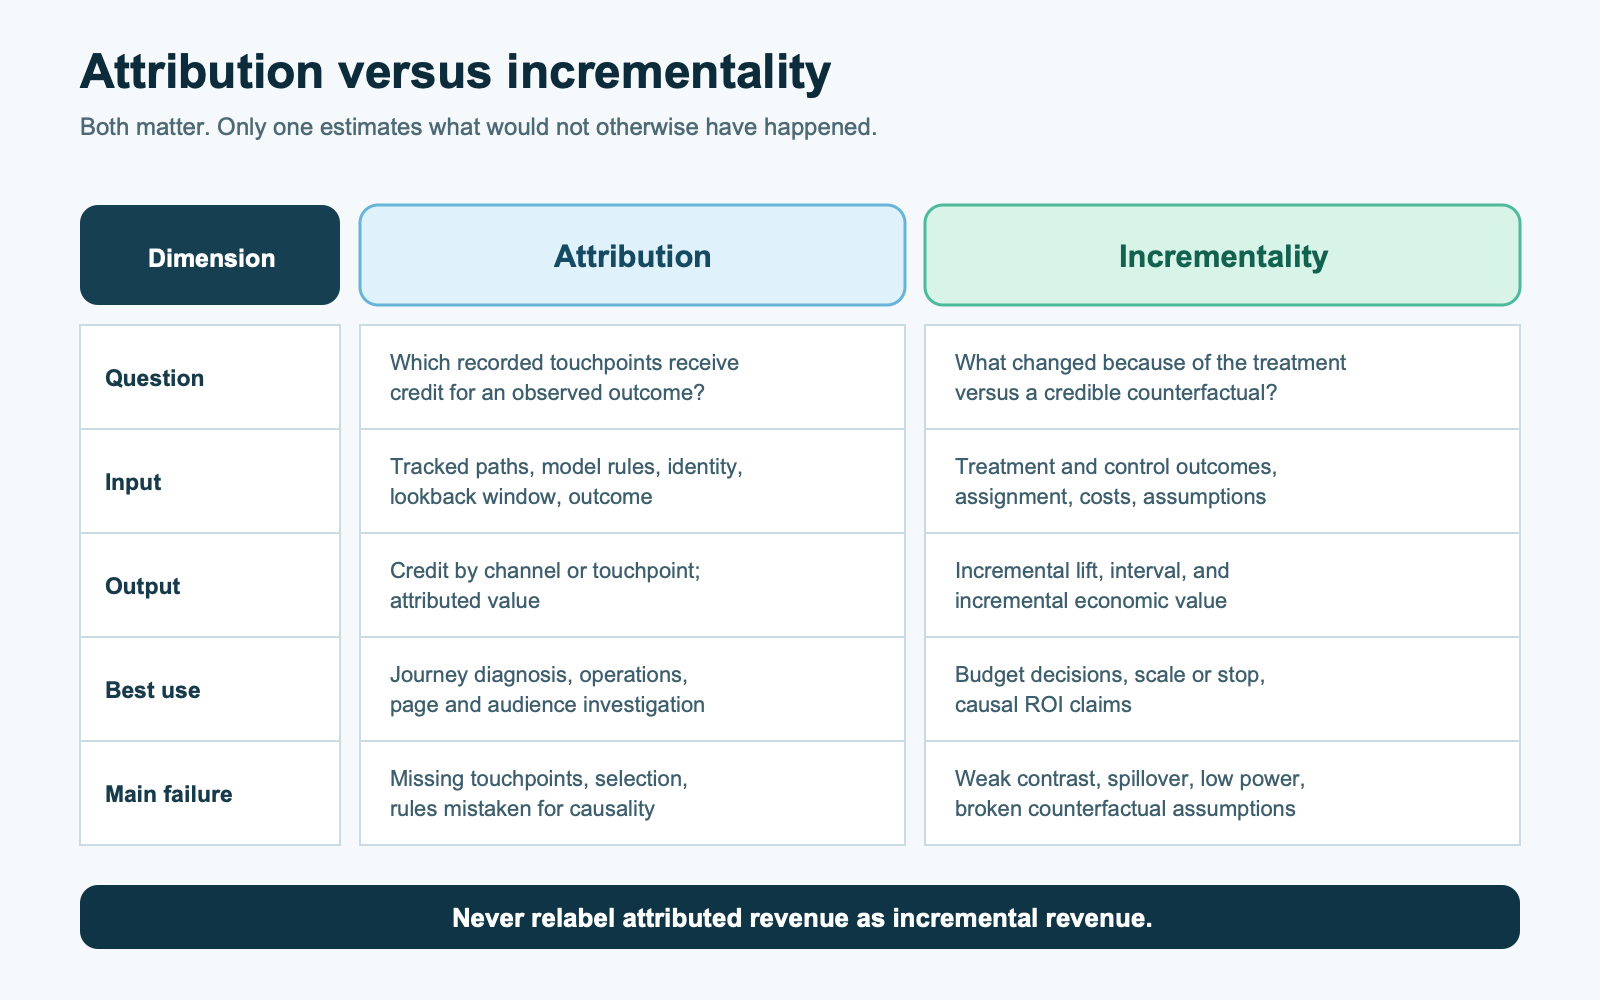
The distinction is not philosophical. Blake, Nosko, and Tadelis randomized paid-search availability across 210 US media markets for eBay. Conventional observational estimates implied strongly positive returns; the experiment’s preferred estimate was a short-term ROI of −63%. The result is bounded to a famous brand, a paid-search intervention, the study period, and its outcome window. It does not estimate AI search. It demonstrates the substitution problem: people who use a measured search path can be the same people who would have reached the business another way.8
Gordon and colleagues compared observational methods with 15 randomized Facebook advertising experiments comprising 500 million user-experiment observations and 1.6 billion ad impressions. Even with extensive demographic and behavioral variables, observational estimates often missed the experimental lift; in half the studies, the estimated purchase lift was off by at least a factor of three across all tested methods. Most estimates were too high, but some were too low.9 The lesson is not that every attribution model exaggerates every channel. It is that rich path data cannot guarantee removal of selection bias.
Use a worked example that keeps both ledgers visible
Consider a hypothetical B2B software company that spends $30,000 over a quarter on AI-search research, editorial production, engineering, and measurement. Its CRM records $72,000 of revenue on journeys containing an identifiable AI referral or a self-reported AI discovery. At a 70% gross margin, the attributed gross profit is $50,400. The attributed ROI calculation is:
Attributed ROI = ($72,000 × 70% − $30,000) ÷ $30,000 = 68%
That is a valid labeled accounting view if the path rule, window, deduplication, and costs are correct. It is not yet an incremental ROI. A matched rollout analysis later estimates $28,000 of incremental revenue, with a 95% interval from $8,000 to $48,000. Applying the same margin gives a point estimate of $19,600 in incremental gross profit and this causal accounting view:
Incremental ROI estimate = ($28,000 × 70% − $30,000) ÷ $30,000 = −34.7%
95% interval under the design assumptions: −81.3% to +12.0%
The honest conclusion is not that the work certainly lost money. The experiment is consistent with a substantial loss and a modest gain. The next decision may be to narrow the program, improve power, extend the outcome window, or test a higher-contrast intervention. Reporting only the 68% attributed ROI would hide the most important evidence. Reporting only the negative point estimate would hide the uncertainty.
Always calculate value using contribution or gross profit, not top-line revenue, unless the business deliberately uses a revenue-return metric. Include content production, engineering, data, tools, agency fees, internal time, refreshes, and allocated measurement cost. State whether the numerator uses booked revenue, collected revenue, gross profit, expected lifetime value, or retained value. A precise formula with the wrong economics is still a misleading ROI.
Choose an incrementality design that matches your scale
Randomization is strongest when units can receive meaningfully different treatment without contamination. AI-search optimization is public, slow, and entangled with ordinary SEO, so a perfect AI-only holdout is rarely available. Define the treatment as the work you can actually control: for example, a documented package of evidence improvements, technical fixes, internal linking, and distribution applied to eligible topic clusters.
For larger sites: randomized or staggered cluster rollout
Build comparable page or topic clusters before changing them. Randomly assign the release package to some clusters now and the rest later. Measure supported visibility, identifiable visits, qualified outcomes, and total organic outcomes at the cluster level. Check pre-period balance, prevent the team from selectively promoting treatment pages, and report spillover: citations to one page may influence branded demand or visits elsewhere.
This estimates the effect of the package on the selected clusters, not the isolated effect of “AI visibility.” It can also capture conventional search impact. That is acceptable if the investment decision concerns the package; it is not acceptable to rename the estimate as a platform-specific effect.
For multi-market businesses: geo experiments
If the intervention can vary by market—local evidence, localized distribution, sales enablement, or media amplification—select treatment and control geographies using a stable pre-period. Protect against national campaigns, pricing changes, stock constraints, and spillover. Define the outcome and minimum detectable effect before the test. Geo designs have fewer units than user-level tests, so uncertainty may be wide.
For small sites: bounded time-series evidence
A small site may not have enough pages, markets, or conversions for a powered holdout. Use an interrupted or staggered time series with untreated comparison metrics, a long baseline, and an intervention log. Report it as quasi-experimental or directional. Do not use a simple before/after change when seasonality, a launch, a campaign, a site migration, or broader search demand changed at the same time.
Google presents marketing mix modeling, incrementality experiments, and attribution as complementary instruments. Meridian is an open-source Bayesian marketing mix model designed to account for media, controls, lagged response, and uncertainty; its current documentation also supports calibration with experiment results.5 A model can organize aggregate evidence, but it does not manufacture identification. Small samples, correlated interventions, priors, omitted demand drivers, and unstable platform behavior can dominate the estimate.
Google’s own incrementality guidance defines the target as what happened because of marketing and would not otherwise have happened. It distinguishes attribution’s journey credit, incrementality’s causal campaign or channel effect, and marketing mix modeling’s aggregate view across channels and external factors.6 Use that taxonomy, while treating the document’s product-performance figures as first-party claims rather than independent evidence.
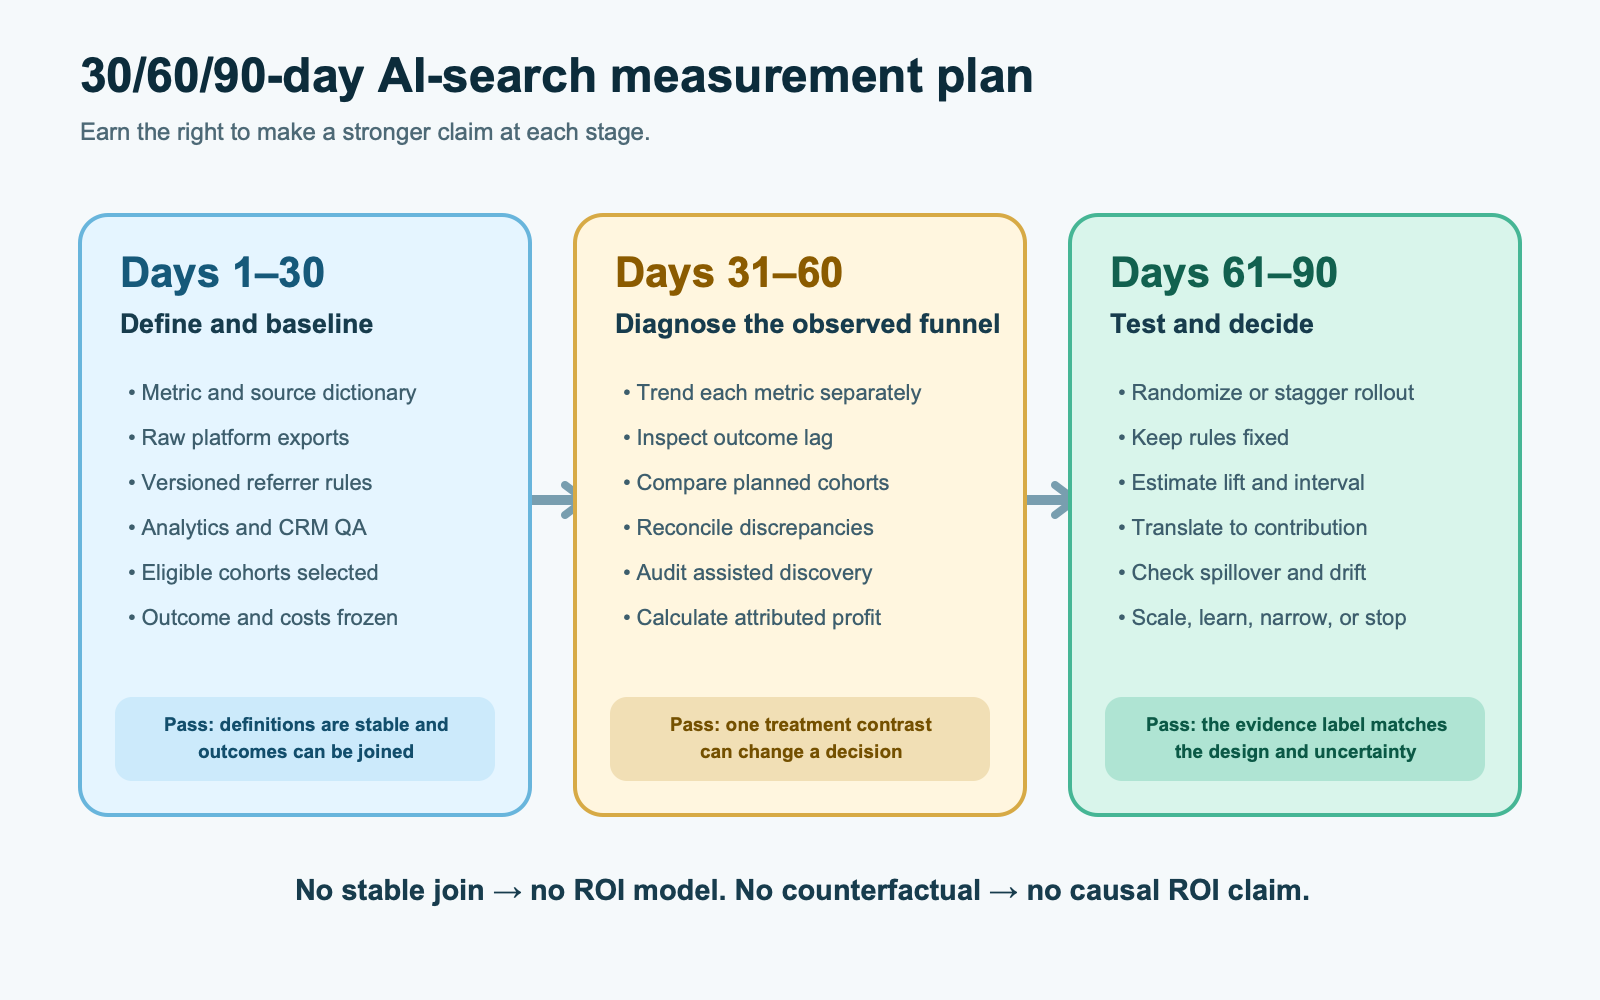
Plan the first 90 days as a sequence of decisions
Days 1–30: define, instrument, and baseline
- Write a metric dictionary with event definition, unit, source, owner, timezone, latency, known omissions, and coverage-change rules.
- Export Google AI-feature impressions and Bing AI citations without combining them; preserve page, country, device, and date where available.
- Create a versioned AI-referrer classification and retain raw source/medium values.
- Validate analytics tags, consent behavior, key events, CRM joins, revenue status, refund handling, gross margin, and duplicate leads.
- Choose eligible page or topic clusters before optimization and record at least the available pre-period.
- Freeze the primary outcome, guardrails, cost boundary, analysis window, and minimum change that would justify more investment.
The 30-day deliverable is not a triumphant ROI. It is a trustworthy baseline and a list of blind spots. If the business cannot join a qualified outcome to a stable landing page or cohort, fix that before creating a sophisticated attribution model.
Days 31–60: diagnose the observed funnel
- Trend visibility, referrals, assisted-demand indicators, qualified outcomes, and costs by topic cluster—not only sitewide.
- Inspect lag from first observed touch to lead, opportunity, and collected revenue.
- Compare new versus returning users, device, country, page intent, customer type, and product complexity only where sample sizes support it.
- Reconcile large Search Console/analytics discrepancies and annotate classifier, consent, site, and platform changes.
- Audit sales and survey evidence for untracked discovery, with response rates and an “unknown” category.
- Calculate attributed contribution profit and cost per qualified outcome, clearly labeled as observational.
Use this phase to select a plausible treatment contrast. If visibility rises but the pages attract no identifiable or assisted demand, improve the offer, audience fit, or measurement before scaling production. If high-intent outcomes appear in one cluster, test the repeatable package rather than copying its last-click ROI into a forecast.
Days 61–90: run the strongest feasible test
- Randomize or stagger the treatment across preselected clusters or markets when feasible; otherwise document the quasi-experimental design.
- Keep treatment, outcome, window, exclusion rules, and stopping rule fixed.
- Report the point estimate, interval, sample, pre-period fit, spillover risks, and any deviations.
- Translate incremental revenue to contribution profit with the same margin and cost boundary used in planning.
- Decide: scale, continue learning, narrow the audience, change the package, or stop.
- Preserve both ledgers so operational teams can improve execution without promoting attributed value into causal proof.
Build the minimum viable dashboard
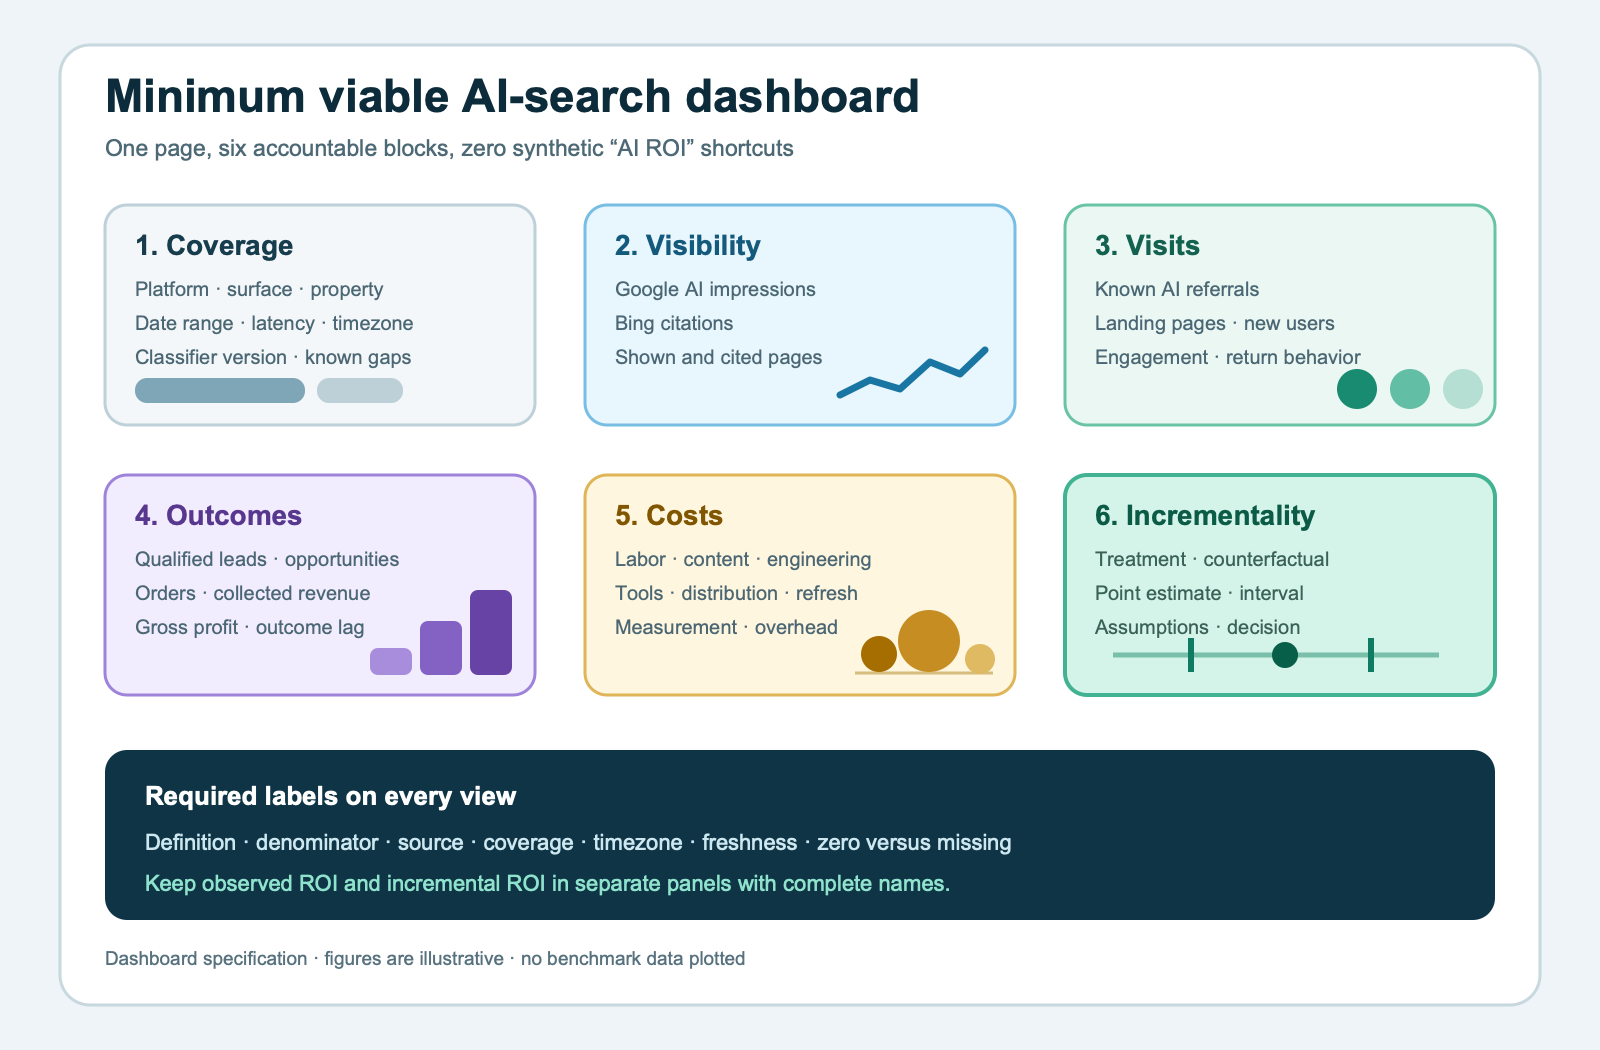
The dashboard can be one page. Complexity belongs in the data dictionary, not in decorative charts. Include these six blocks:
- Coverage: platform, surface, property, date range, data latency, classifier version, and known missing journeys.
- Visibility: Google AI impressions and Bing citations as separate trends, plus cited or shown pages.
- Visits: identifiable AI referrals, landing pages, new users, engagement, and return rate.
- Outcomes: qualified leads, opportunities, orders, collected revenue, gross profit, and lag distribution.
- Costs: labor, content, engineering, tooling, distribution, refresh, measurement, and allocated overhead.
- Incrementality: treatment, counterfactual, point estimate, interval, test status, assumptions, and decision.
Every tile should expose its denominator in the label or tooltip. Show zeros separately from missing data. Mark preliminary platform data. Put annotations on releases, campaigns, pricing changes, tracking changes, outages, and platform-definition changes. Display observed ROI and incremental ROI in different sections with different colors and complete names; abbreviating both to “ROI” invites screenshots without context.
Define decision thresholds before the result arrives
A measurement system becomes valuable when it changes a decision. Write thresholds before seeing the outcome:
- Scale: the lower bound of incremental contribution profit clears the hurdle rate, guardrails hold, and the treatment is repeatable.
- Continue learning: the interval crosses the hurdle but the design has adequate integrity and another period can materially improve precision.
- Narrow: only specific topics, products, countries, or customer types show a credible signal and the segment was preplanned or is labeled exploratory.
- Fix measurement: joins, cost coverage, outcome quality, or instrumentation changed enough that the series is not comparable.
- Stop: the upper bound cannot clear the hurdle, the opportunity cost is higher elsewhere, or the program cannot produce a testable contrast.
Lewis and Rao’s 25 large US advertising experiments show why an inconclusive result is not the same as no effect. Most experiments reached more than one million people, yet the median confidence interval on ROI exceeded 100 percentage points. The median campaign would have needed nine times the sample to distinguish a 50% ROI from break-even with the authors’ power target.10 These figures come from display advertising in 2007–2011, not AI search. Their transferable lesson is about power: when incremental profit is small relative to outcome volatility, even a well-designed experiment may be too imprecise for a binary verdict.
Do not solve low power by hiding intervals or repeatedly checking until a favorable result appears. Increase the treatment contrast, improve the outcome’s signal-to-noise ratio, pool compatible cohorts, extend the test when carryover assumptions allow it, or accept that the available scale only supports a directional decision.
What the evidence does not show
- Google AI-feature impressions do not reveal clicks, queries, conversions, revenue, answer placement, or incremental demand.
- Bing citation counts do not reveal ranking, authority, page importance, placement, reader attention, or causal business value.
- An identifiable AI referral is not a census of AI-influenced journeys; missing or changed referrer data can hide exposure.
- A high referral conversion rate does not prove the channel created those conversions; user intent and selection can explain part of the difference.
- The 973-site ecommerce study does not establish performance for B2B, publishers, local services, other periods, or untracked upper-funnel influence.
- Paid-ad experiments demonstrate attribution risk and statistical-power limits; their effect sizes are not forecasts for organic AI-search work.
- A cluster, geo, or time-series test identifies only the defined treatment under its assumptions; it rarely isolates an AI platform from ordinary SEO.
- No reviewed source provides a universal AI-search ROI benchmark, attribution window, conversion premium, or minimum profitable visibility level.
A practical measurement specification
Copy this template into the experiment brief before implementation:
Decision: What budget, scope, or workflow will change?
Treatment: What exactly will eligible pages, markets, or teams receive?
Primary outcome: One business measure, unit, source, qualification rule, and window.
Leading indicators: Platform-specific visibility, identifiable visits, and assisted-demand signals.
Counterfactual: Randomized holdout, delayed rollout, matched geography, or documented model.
Economics: Contribution margin, complete incremental cost, hurdle rate, and lifetime-value policy.
Uncertainty: Interval, power or detectable-effect target, spillover, missing data, and sensitivity checks.
Decision rule: Scale, learn, narrow, fix, or stop—and the threshold for each.
Evidence label: Observational, quasi-experimental, or randomized causal estimate.
What to do this week
- Export the new Google AI-feature impression report and Bing AI Performance data available to your properties; do not merge their event counts.
- Write one page of definitions for AI visibility, identifiable referral, assisted discovery, qualified outcome, attributed value, and incremental value.
- Audit the top ten AI-associated journeys from raw source through CRM and collected revenue, including consent and duplicate handling.
- Calculate one attributed-profit view using complete costs and label it “observed,” not “caused.”
- Select comparable topic clusters or markets for a delayed rollout and document why the contrast could identify the investment package.
- Set the 90-day decision threshold and the largest uncertainty that could reverse it.
After 30 days, change course if the data definitions are unstable, the outcome cannot be joined, or the intervention cannot create a credible contrast. After 60 days, change the offer or audience if visibility grows without qualified demand. After 90 days, scale only when the incremental estimate and its uncertainty can support the hurdle—not because a visibility chart is moving upward.
Visibility can earn a test, not a verdict
AI-search measurement is finally gaining better first-party instruments. That is real, decision-useful progress. It also makes disciplined labels more important. An impression is evidence of an appearance. A citation is evidence of source display on a covered surface. A referral is evidence of an identifiable route. Attribution is a model of credit across observed paths. Incrementality is an estimate of what changed because of the treatment.
Keep those statements intact from dashboard to board meeting. Connect them with a metric tree, a complete cost ledger, and the strongest feasible counterfactual. The result may be a confident scale decision, a narrower experiment, or an honest “not yet identifiable.” All three are more valuable than a precise ROI number built from assumptions no one wrote down.
Sources
- Google Search Central, “Introducing Search Generative AI performance reports in Search Console”, June 3, 2026, updated August 31, 2026; and “Generative AI performance report (Search)”. First-party product announcement and technical documentation.
- Microsoft Bing Webmaster Tools, “Introducing AI Performance in Bing Webmaster Tools Public Preview”, February 10, 2026. First-party product documentation.
- Google Search Central, “Using Search Console and Google Analytics data for SEO”, updated January 7, 2026. First-party technical documentation.
- Google Analytics Help, “Get started with attribution”, reviewed September 4, 2026. First-party product methodology.
- Google, “Meridian”, reviewed September 4, 2026. First-party open-source marketing mix modeling documentation.
- Google Ads Help, “Strengthen media measurement and ROI clarity with incrementality testing improvements”, November 11, 2025. First-party product guidance.
- Maximilian Kaiser and Christian Schulze, “Frontiers: ChatGPT referrals to e-commerce websites: How do LLMs compare against traditional channels?”, Marketing Science, published online April 21, 2026. Peer-reviewed descriptive study.
- Thomas Blake, Chris Nosko, and Steven Tadelis, “Consumer heterogeneity and paid search effectiveness: A large-scale field experiment”, Econometrica 83(1), 2015, pp. 155–174. Peer-reviewed field experiment.
- Brett R. Gordon, Florian Zettelmeyer, Neha Bhargava, and Dan Chapsky, “A comparison of approaches to advertising measurement: Evidence from big field experiments at Facebook”, Marketing Science 38(2), 2019, pp. 193–225. Peer-reviewed experimental comparison.
- Randall A. Lewis and Justin M. Rao, “The unfavorable economics of measuring the returns to advertising”, The Quarterly Journal of Economics 130(4), 2015, pp. 1941–1973. Peer-reviewed analysis of 25 randomized field experiments.