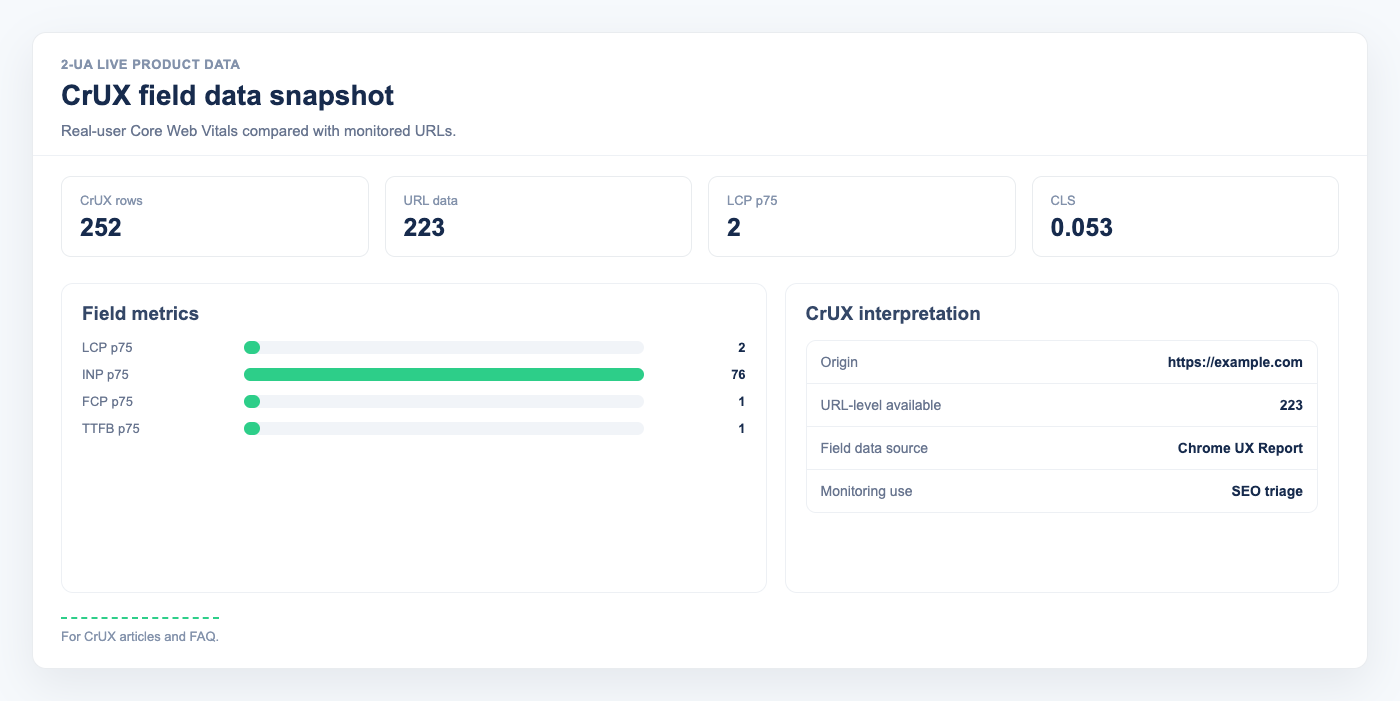
Google PageSpeed Insights gives you lab scores — synthetic tests run on a single machine. CrUX (Chrome User Experience Report) gives you field data — measurements from millions of real Chrome users visiting your actual pages. These two views often disagree, and Google ranks you based on field data.
Lab data vs field data
- Lab data (PageSpeed Insights, Lighthouse) runs in a controlled environment. It is deterministic and useful for debugging but does not reflect real user conditions: device diversity, network quality, ad scripts, or CDN performance under load.
- Field data (CrUX) aggregates real Chrome user sessions over 28 days. It accounts for geographic distribution, device mix, and actual network conditions. This is what Google's Core Web Vitals ranking signal uses.
The five Core Web Vitals metrics
- LCP — Largest Contentful Paint: when the largest visible element finishes rendering. Good: ≤2.5s. Needs improvement: ≤4s.
- CLS — Cumulative Layout Shift: total unexpected visual instability. Good: ≤0.1. Needs improvement: ≤0.25.
- FCP — First Contentful Paint: when the first text or image appears. Good: ≤1.8s. Needs improvement: ≤3s.
- INP — Interaction to Next Paint: responsiveness to user interactions. Good: ≤200ms. Needs improvement: ≤500ms.
- TTFB — Time to First Byte: server response latency. Good: ≤0.8s. Needs improvement: ≤1.8s.
All values shown are p75 — the 75th percentile of real user sessions.
URL-level vs origin-level data
CrUX requires a minimum number of user sessions to report data for a specific URL. Low-traffic pages often fall below this threshold. In that case, 2-UA automatically falls back to origin-level data (aggregated for the entire domain) and marks the record as "Origin fallback" so you know the source.
How 2-UA collects CrUX data
For each desktop-tracked URL with expected status 200, 2-UA queries the CrUX API v1 using the same Google API key as PageSpeed Insights. Results are stored per URL and updated on each check cycle. Both URL-level and origin-level values are saved so you can compare them.
Open any tracked URL → Quick menu → CrUX field data to see the p75 values colour-coded by Google's thresholds (green / yellow / red). The site-wide summary shows all your tracked desktop URLs in one table.
Using CrUX data in practice
- Compare CrUX LCP against your lab LCP. Large gaps often indicate CDN variability or slow regions.
- Use CrUX CLS to verify that your layout shift fixes actually reached real users.
- Monitor TTFB field data after server-side changes — lab TTFB misses caching and geographic latency.
- Track INP if you have interactive elements. A high INP on real users means your JS is blocking input.
- Pages with "Origin fallback" need more traffic before URL-level data appears — consider internal linking or paid traffic to build the dataset.