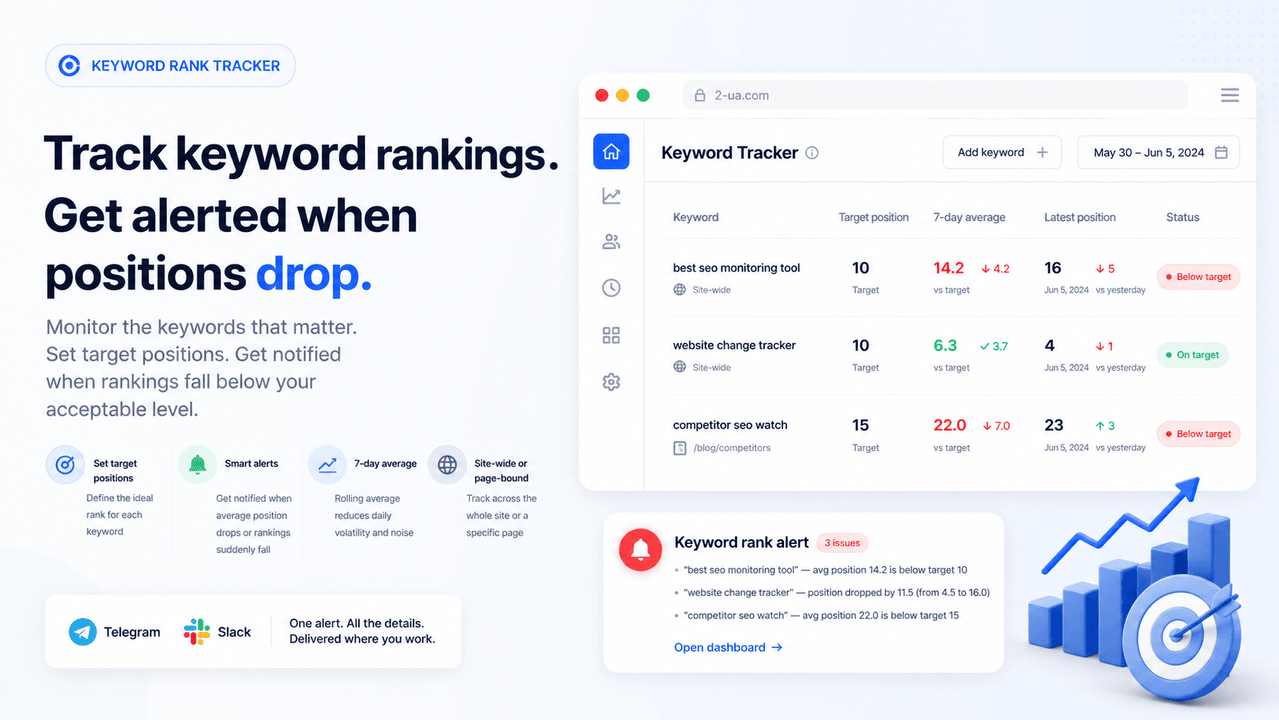
The GSC Query Monitor watches selected queries against custom target positions and sends a Telegram or Slack alert when one crosses a threshold. It uses your existing Google Search Console connection, so there is no separate SERP fetcher.
- Open your projects, open your website, and click "GSC Query Monitor".
- Add a query. Pick a target position — the lower, the stricter.
- Optionally adjust the averaging window (1–30 days, default 7). The threshold rule fires when the average over the window is worse than the target.
- On eligible plans, optionally enable the drop-step alert for a material change between adjacent reporting windows.
- Optionally bind the query to a specific tracked URL, or review up to two landing pages as evidence of possible cannibalization.
Data refreshes once a day after the GSC import completes (~04:30 UTC). Search Console commonly reports with a 2–3 day delay. Average position is weighted by real impressions and can vary by page, device, country, location, and search history; it is not a fixed live SERP position.
Alerts are aggregated per site — one consolidated message lists every query that crossed a threshold. There is a 24-hour cooldown per query, and cooldown is consumed only when the message is actually delivered, so quiet hours do not silently swallow alerts.
Ask us about this workflow
Send the page or report you are working with and describe where you are stuck.