Crawling Commercial MOFU

Compare source, rendered, and Googlebot HTML on any page

See when JavaScript or user-agent handling changes titles, canonicals, robots directives, headings, schema, links, or visible content.

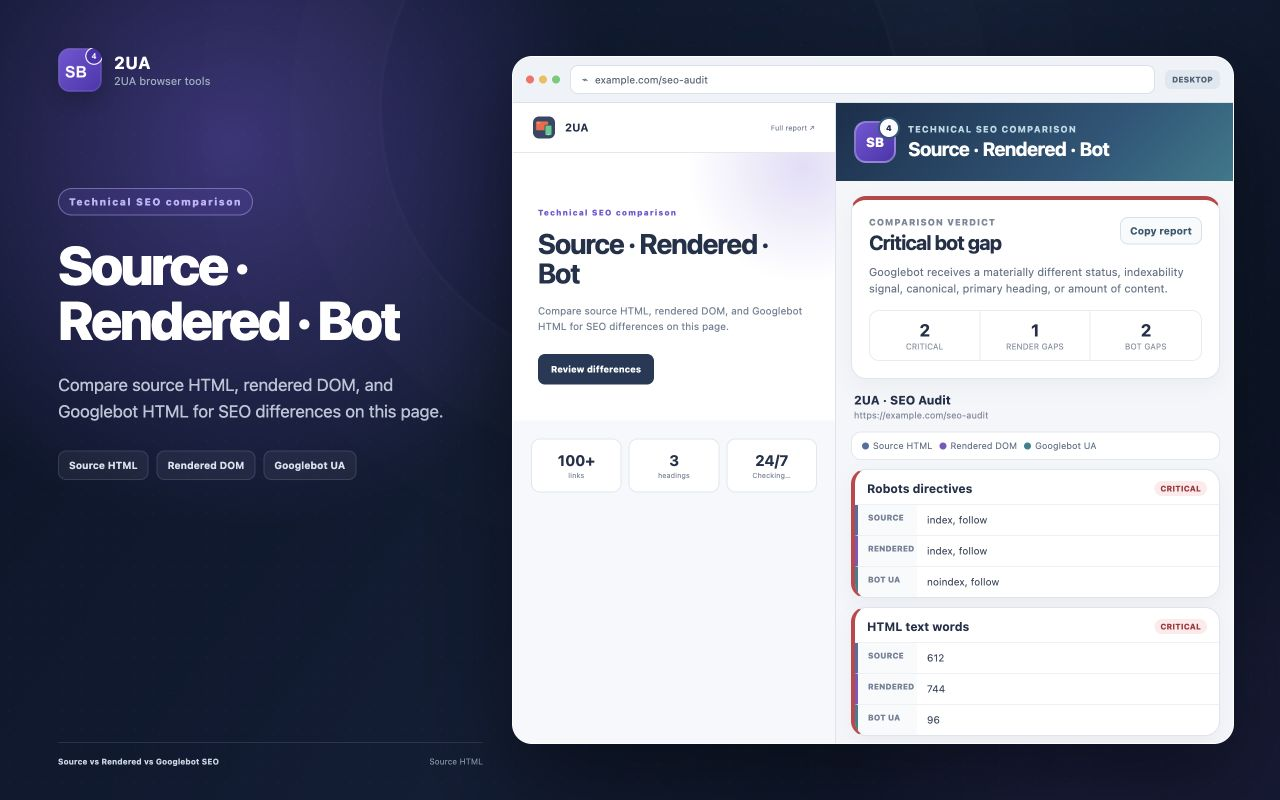
Source vs Rendered vs Googlebot SEO Chrome extension showing a critical robots and content gap
One report compares the server response, live rendered DOM, and a Googlebot Smartphone user-agent response.

A page can have three materially different SEO states: the HTML returned by the server, the DOM a user sees after JavaScript runs, and the response returned when the request uses a Googlebot Smartphone user-agent string. Comparing those states on the current URL is a fast way to expose rendering gaps and user-agent-specific regressions.

The three versions in one report

  • Source HTML: a direct request to the current URL without cookies.
  • Rendered DOM: the live document after the page's JavaScript has run in your active tab.
  • Googlebot UA: a cookie-free request using Googlebot Smartphone's user-agent string.

What the extension compares

Source vs Rendered vs Googlebot SEO checks the signals most likely to change during rendering or request handling: HTTP status, title, meta description, H1, canonical, meta robots, X-Robots-Tag, visible text word count, internal links, and JSON-LD schema types. The report separates ordinary render differences from critical bot gaps and can be copied into a developer ticket.

DifferenceWhat it may indicate
Source has little content; rendered DOM is completeImportant content or links depend on client-side JavaScript.
Canonical or robots appears only after renderingSearch directives are injected late and deserve crawler verification.
Googlebot-UA response differs from normal sourceCDN, WAF, server, or application logic varies by user agent.
Schema types disappear in one stateStructured data is conditional, injected, or stripped on one delivery path.
Internal-link count drops sharplyNavigation or related links are unavailable in that version.

A practical review workflow

  1. Open the exact public URL you want to audit and wait for its normal interface to finish loading.
  2. Launch the extension from the Chrome toolbar; the comparison opens in the side panel.
  3. Start with the verdict, then review every signal marked as a render gap or bot gap.
  4. Copy the report and attach it to the issue with the affected URL, expected value, and acceptance criteria.
  5. After the fix, rerun the same URL and confirm the intended signals match across all three states.
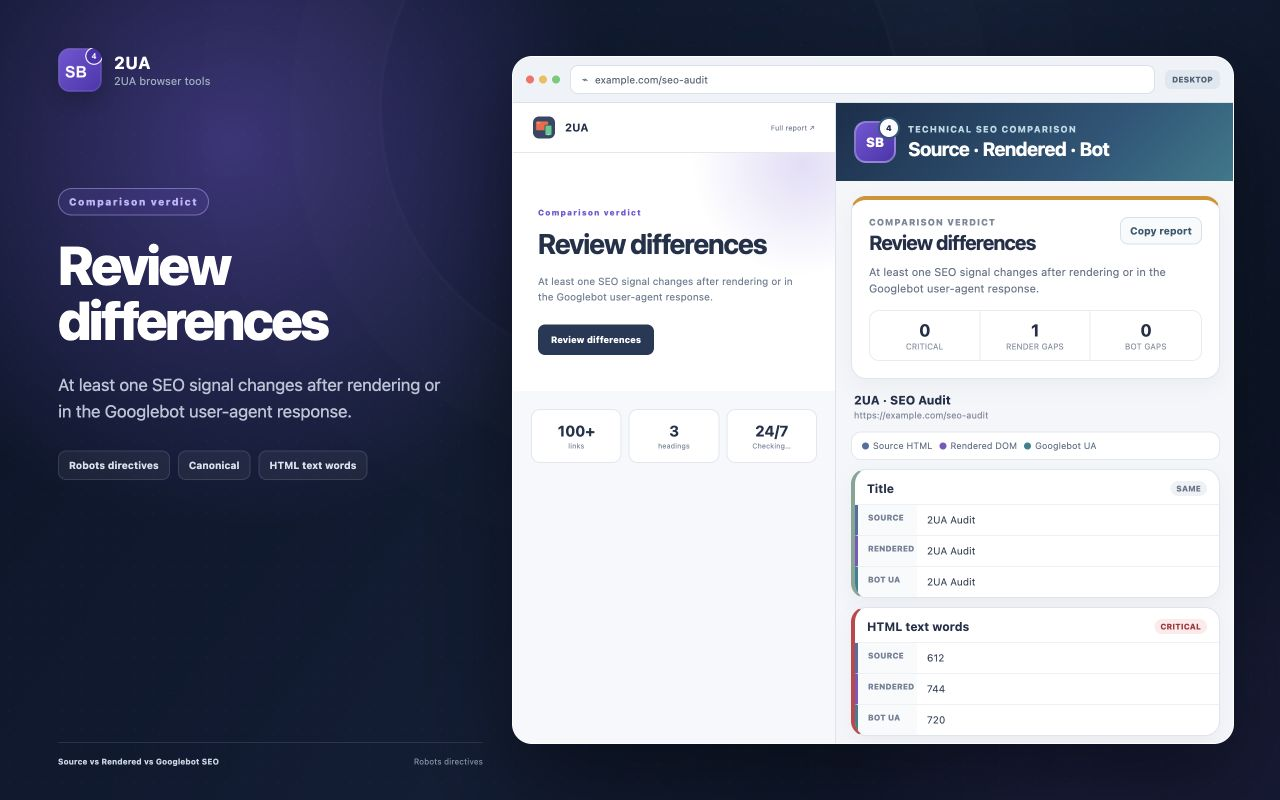
Source Rendered Bot extension report comparing title and HTML word count across source HTML, rendered DOM, and Googlebot user-agent responses
Matching values are easy to scan, while render and bot gaps are counted separately in the comparison verdict.

How to interpret a JavaScript rendering gap

A difference is not automatically a defect. Analytics widgets, account controls, timestamps, and interactive content may legitimately exist only after JavaScript runs. Focus on elements search systems need to understand and discover the page: the main content, primary heading, canonical, indexability directives, structured data, and crawlable internal links.

If source HTML is thin but the rendered DOM is complete, test a representative set of URLs from the same template. A single-page comparison is ideal for diagnosis; a rendered and non-rendered crawl is better for measuring the pattern across a site.

What “Googlebot UA” does and does not mean

The extension temporarily changes the User-Agent header for one exact URL. The request still comes from your browser and IP address. It is not a verified Google crawler request, Google Search Console URL Inspection, or Google's Web Rendering Service. The result can reveal user-agent-dependent delivery, but it cannot prove exactly what Google fetched or rendered.

Escalate a suspicious difference with first-party evidence: check URL Inspection, review server or CDN logs, verify Googlebot IPs when relevant, and reproduce the response outside the extension. The comparison is a diagnostic lead, not a claim about Google indexing.
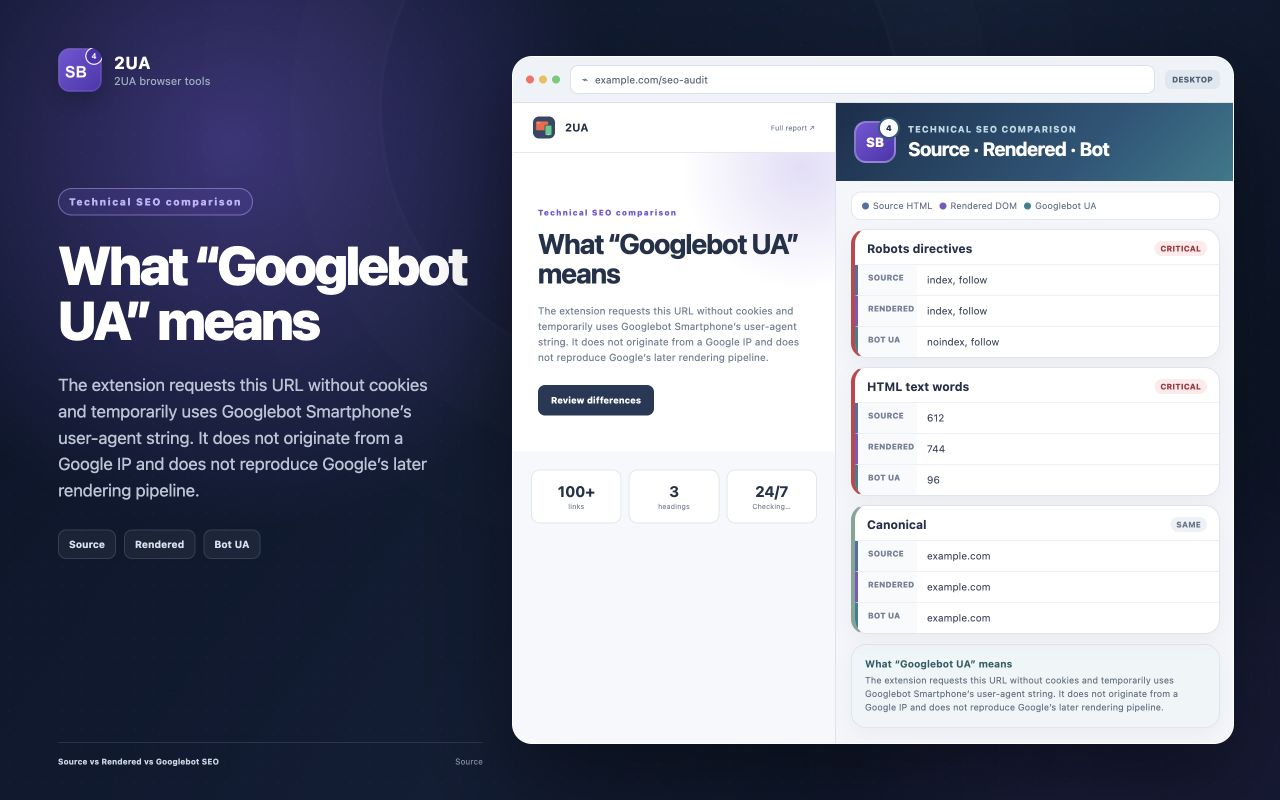
Source Rendered Bot extension explaining the limits of its Googlebot Smartphone user-agent simulation
The report states the simulation boundary directly so a user-agent response is not mistaken for verified Googlebot evidence.

Privacy model

The extension reads the active tab after you invoke it and makes two direct, cookie-free requests to that exact URL. Page content, URLs, reports, and browsing history are not sent to 2-UA or an analytics service. The temporary Chrome session rule used for the user-agent request is removed immediately after the request completes.

Run the three-way comparison

Install the extension, open a public page, and review its source, rendered, and Googlebot-UA signals side by side.

Install Source vs Rendered vs Googlebot SEO

Execution blueprint for source rendered Googlebot comparison

Long-form SEO implementation fails when teams try to “fix everything” at once. The sustainable approach is to define a narrow execution lane, prove measurable movement, and scale based on validated impact. For crawling workflows, this usually means setting explicit ownership, reporting cadence, and escalation thresholds.

A useful way to operationalize this is to split work into three layers: detection, validation, and rollout. Detection finds anomalies quickly. Validation confirms whether the anomaly is material or incidental. Rollout converts validated findings into engineering and content tasks with deadlines. If one layer is missing, the process becomes either noisy or slow.

90-day rollout plan

Days 1-14: baseline and instrumentation

  • Define the monitored scope: templates, critical URLs, and ownership groups.
  • Set expected behavior for status codes, redirects, and indexation-relevant rules.
  • Enable alerts in your team channel and set an initial noise-control policy.
  • Run the first full crawl and preserve it as a technical baseline snapshot.
  • Document the current known issues so future alerts can be triaged faster.

Days 15-45: controlled improvement

  • Move from URL-level fixes to issue-family fixes (template/system level).
  • Review trends weekly for response time, quality checks, and crawl findings.
  • Introduce tag-based segmentation if your team supports multiple page clusters.
  • Track fix validation in re-crawls and keep a short evidence log for each change.
  • Escalate only high-impact regressions to engineering to avoid context switching overload.

Days 46-90: scale and commercialization

  • Standardize recurring reports for stakeholders and client-facing communication.
  • Harden your alert policy with quieter thresholds and clear severity levels.
  • Expand monitoring from critical templates to full coverage where justified.
  • Turn recurring findings into preventive engineering tasks, not one-off tickets.
  • Connect technical trend movement to revenue-adjacent metrics for executive buy-in.

Measurement model: what to track weekly

You should define a compact KPI stack that reflects both technical quality and operational speed. Over-measuring creates reporting overhead and weakens decision quality. A practical KPI model for this topic includes:

  • Detection speed: time from change occurrence to first alert.
  • Triage speed: time from alert to issue classification and owner assignment.
  • Resolution speed: time from assignment to verified fix.
  • Regression rate: how often a fixed issue class returns within 30 days.
  • Coverage quality: share of critical pages included in active monitoring.
  • Business relevance: proportion of high-impact issues in total issue volume.

For mature teams, the strongest KPI is not total issue count but high-impact issue recurrence. When recurrence falls, process quality is improving.

Stakeholder alignment framework

Technical SEO execution usually fails at the handoff boundary. SEO specialists detect issues, but engineering sees isolated tasks without business context. Fix this by sending implementation-ready summaries:

  • What changed (objective signal, not interpretation).
  • Where it changed (template, segment, or specific URL class).
  • Why it matters (indexation, visibility, trust, conversion risk).
  • What to do next (single recommended action with acceptance criteria).
  • How to verify (which re-check confirms the fix).

If your company runs weekly planning, summarize this in one page before sprint grooming. If you run continuous delivery, post a compact incident card into Slack or ticketing with direct links.

Common failure patterns and how to avoid them

  • Too much scope: teams monitor everything and fix nothing. Start with critical assets.
  • No baseline: every alert feels urgent without a reference snapshot.
  • Tool-only mindset: dashboards do not create outcomes without process ownership.
  • One-channel reporting: executives and implementers need different output layers.
  • No post-fix validation: “done” without re-check creates hidden regressions.

Operational checklist you can reuse

  1. Confirm scope and ownership for monitored entities.
  2. Establish expected behavior and escalation policy.
  3. Launch baseline checks and preserve initial state.
  4. Run weekly issue-family review with implementation owners.
  5. Validate completed fixes with scheduled re-checks.
  6. Report only high-signal movements to leadership.
  7. Iterate thresholds every 2-4 weeks based on false-positive rate.

Commercial impact: turning technical work into revenue protection

Teams buy monitoring platforms when they can prove one thing: technical signals reduce preventable loss and shorten recovery time. In practice, you can demonstrate this by documenting incidents prevented, recovery cycles reduced, and implementation throughput improved.

This is where aggressive execution beats passive auditing: instead of producing occasional reports, you build an operating system for technical SEO quality. Once that system is in place, scaling to more URLs, more sites, and more stakeholders becomes predictable.

Advanced FAQ for source rendered Googlebot comparison

How much historical data is enough for reliable decisions?

For most SEO teams, 4 to 8 weeks of consistent monitoring is enough to separate random fluctuation from structural movement. If your release velocity is high, use shorter review cycles but keep a rolling 8-week reference window. The key is consistency: gaps in monitoring reduce interpretability more than imperfect metrics.

Should we optimize for issue count reduction or impact reduction?

Always optimize for impact reduction. Lower issue count can be misleading if high-severity classes remain unresolved. In mature workflows, teams track high-impact recurrence, time-to-resolution, and incident spread by template class.

What is the best cadence for reporting this topic to leadership?

Weekly operational review plus a monthly executive summary works best. Weekly reports should focus on changes, actions, and blockers. Monthly reports should focus on trend direction, prevented incidents, and business-risk reduction. This two-layer model avoids both over-reporting and under-reporting.

How do we keep collaboration smooth with engineering teams?

Convert every finding into an implementation-ready task: define affected scope, expected behavior, acceptance criteria, and verification method. Engineering teams respond faster when tasks are deterministic. Avoid sending raw issue exports without business context.

When should we escalate from soft monitoring to stricter controls?

Escalate when any of the following is true: critical template regressions appear repeatedly, recovery time is increasing, or ownership is unclear across incidents. At that point, tighten alert policy, enforce scope ownership, and add stricter verification gates after releases.

How do we evaluate ROI for this workflow?

ROI appears in three layers: lower incident duration, fewer recurring regressions, and improved implementation confidence across teams. For stakeholder communication, quantify prevented loss events and reduced recovery effort rather than raw technical counts. This framing translates technical monitoring into business language that supports budget decisions.