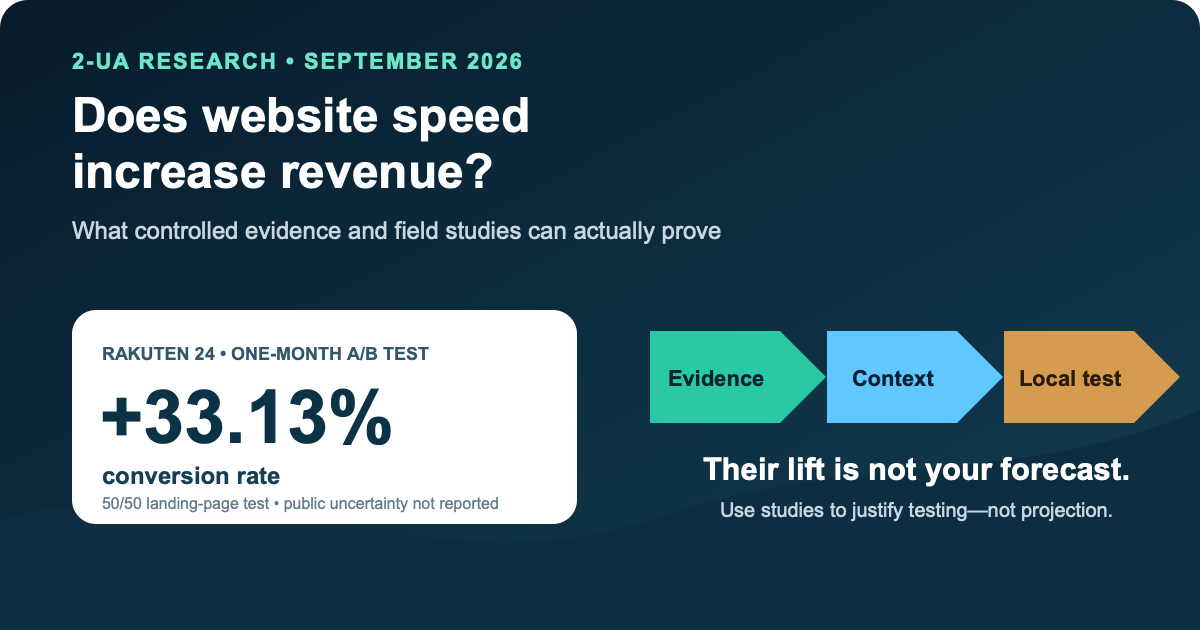
Website speed can increase revenue. Controlled experiments at Bing, Rakuten 24, Vodafone, and Farfetch report business changes when performance changed, while Google Search experiments show that deliberately added latency changed user behaviour.1–5 That is stronger than a slogan: under the tested conditions, performance was part of the causal path.
The evidence does not reveal a universal exchange rate between milliseconds and money. Published effects range from a fraction of a percent to more than 30%, but they refer to different products, users, pages, metrics, baselines, interventions, and disclosure standards. A 100 ms server delay on a desktop search engine is not a 600 ms image-loading improvement on a luxury product page. “Revenue,” “sales,” “conversion,” and “searches per user” are not interchangeable outcomes.
The useful business conclusion is therefore conditional: treat speed as a plausible growth and resilience lever, measure the affected journey in the field, and estimate the local incremental value with a controlled experiment. Use published studies to justify investigation—not to populate the forecast cell.
The answer in one minute
- Yes, a local causal effect is plausible and has been measured. Randomized slowdown and optimization tests show that changing latency can change revenue, sales, conversion, or engagement in a specific system.
- No, the published percentage is not your forecast. Effects vary with the baseline, page, market, traffic, performance phase, device, product economics, and implementation.
- A field correlation is a prioritization signal. Faster sessions converting more often does not prove that speed caused the conversion; intent, device, cache state, route, and survival in the funnel can affect both.
- The best primary outcome usually reflects value per randomized visitor. Revenue or contribution margin per eligible visitor captures conversion and order value without letting one local funnel rate dominate the decision.
- Use performance metrics to verify the treatment. LCP, INP, CLS, TTFB, task time, and error rate explain what changed. They do not replace the business outcome.
- Calculate the break-even effect before the test. The useful question is not “what did Rakuten gain?” but “what minimum lift would repay our cost, and can our traffic distinguish it from noise?”
- Keep the boundary explicit. CrUX and monitoring establish field baselines and regressions. Event-level RUM, experiment assignment, analytics joins, margin data, and causal analysis live in the owner’s analytics stack.
An evidence ladder for speed and revenue
Most debates fail because evidence collected for one decision is used to answer another. A Lighthouse run can find an image-loading opportunity. CrUX can show that eligible Chrome users experience poor LCP at the 75th percentile. Session-level RUM can reveal that slower experiences and lower conversion coexist. None of those observations, alone, estimates the revenue that would have occurred if the same users had received a faster version.
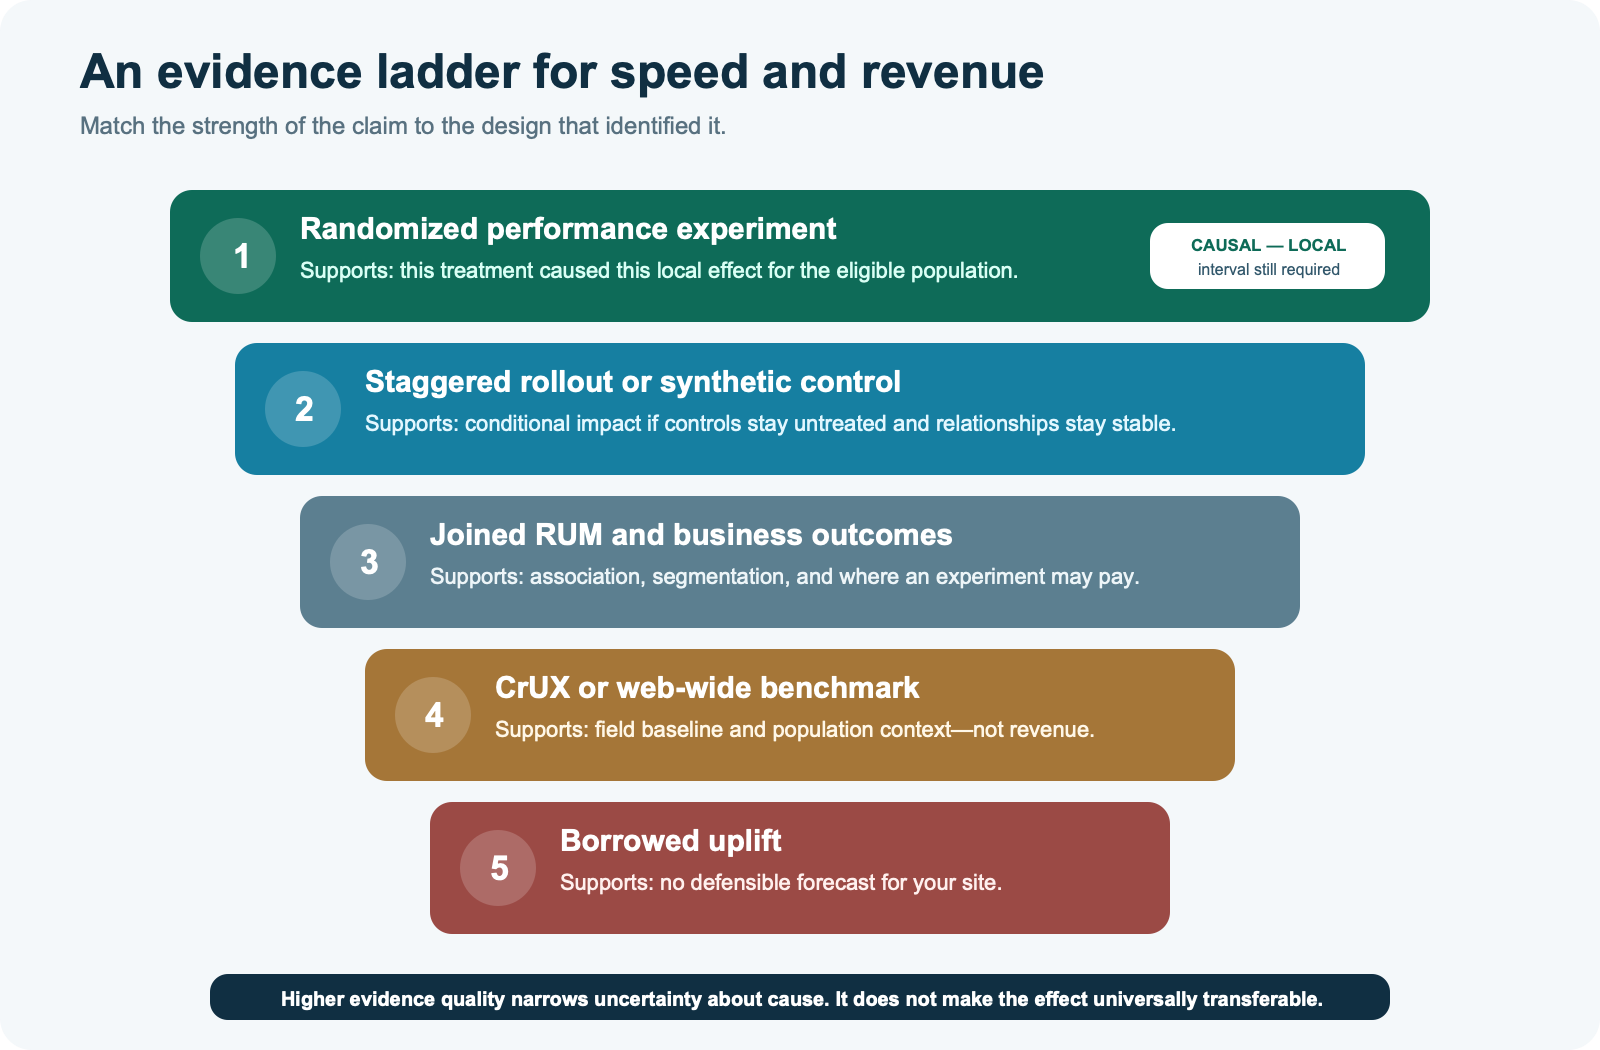
| Evidence | Question it can answer | What remains unknown |
|---|---|---|
| Randomized performance experiment | Did this treatment cause a change for this eligible population during this period? | Effect in another market, journey, baseline, season, or implementation |
| Controlled slowdown test | What is the local cost of added latency at the tested point? | Whether an equal speedup creates a symmetric gain |
| Staggered rollout or synthetic control | Was the post-release outcome inconsistent with a modelled counterfactual? | Whether untreated controls stayed untreated and relationships stayed stable |
| Session-level field association | Which journeys, segments, and performance ranges coincide with value loss? | Direction of causality and unmeasured confounding |
| CrUX or web-wide benchmark | How do eligible real-user experiences compare with thresholds or peers? | Conversions, margin, individual sessions, and all-browser coverage |
| Case-study percentage copied into a model | Nothing defensible about your expected return | Nearly everything that determines transferability |
This hierarchy is not an argument to ignore weaker evidence. It is an instruction to use it correctly. A web-wide benchmark can expose a performance gap. RUM can find the journeys where slow users abandon. A controlled test can estimate the incremental outcome. The mistake is allowing the easiest dataset to make the strongest claim.
What controlled experiments can prove
Bing measured a local revenue cost of latency
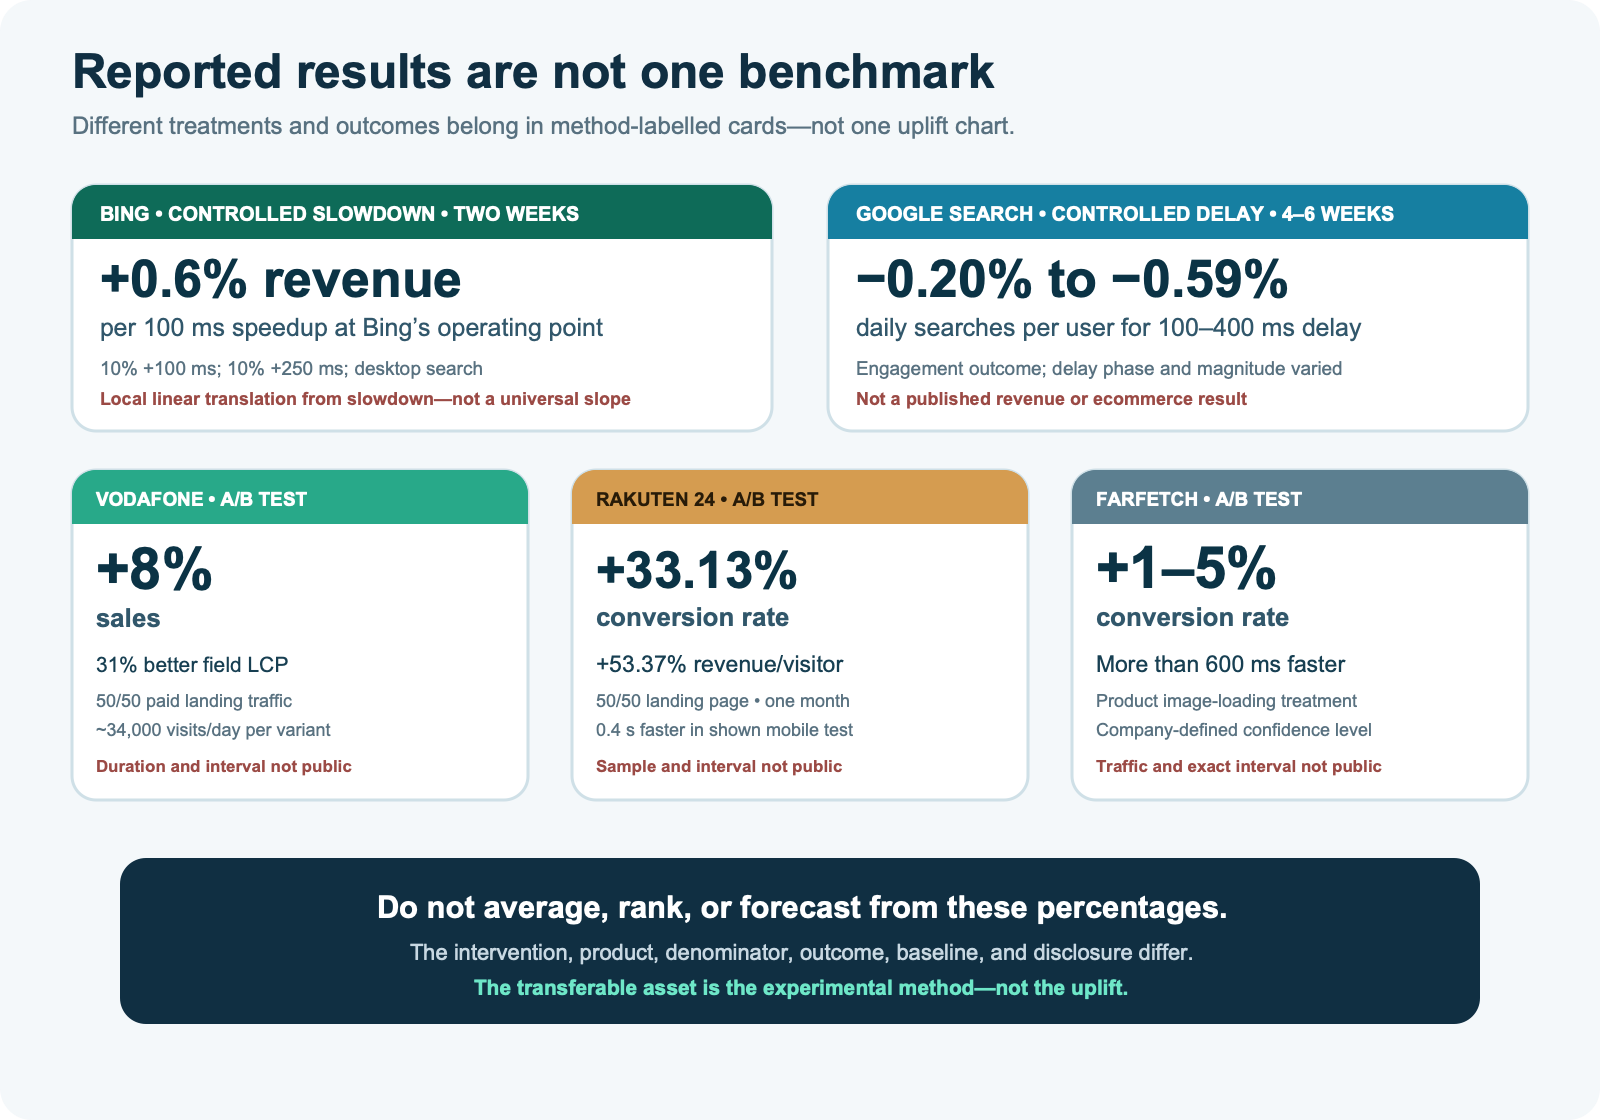
In a two-week Bing experiment, 10% of users received an added 100 ms of server latency and another 10% received 250 ms. The researchers report that, around Bing’s operating point, every 100 ms speedup would improve revenue by 0.6%.3 This is unusually useful evidence because latency was manipulated while control traffic provided the counterfactual.
The careful reading is narrower than “100 ms equals 0.6% revenue.” The treatments were slowdowns. Translating them into a speedup assumed that the local curve was sufficiently linear and symmetric; the authors say multiple slowdown amounts supported that approximation for Bing. The product was desktop web search, funded by advertising, in an earlier technical environment. The estimate helps Bing value a performance team. It does not set the coefficient for an ecommerce checkout in 2026.
The same paper reports an important negative result: delaying a right-side panel by 250 ms produced no detectable movement in key metrics despite nearly 20 million users. Where the delay occurs matters. A global load event can worsen without delaying the content or control that completes the user’s task. “Make the page faster” is therefore too imprecise for either engineering or finance.
Google changed engagement, not published revenue
Google injected server-side delays into Search for four or six weeks. A 100 ms pre-header delay reduced average daily searches per user by 0.20%; 200 ms and 400 ms post-header delays reduced searches by 0.29% and 0.59%. Users exposed to the 400 ms delay still searched 0.21% less than control, on average, during five weeks after the delay was removed.4
The manipulation makes the behavioural effect credible for that product and population. Yet searches per user is an engagement outcome, not booked revenue, profit, or ecommerce conversion. The report also shows that response phase affects perception: a delay before headers, after headers, or after ads can be partly hidden or exposed by network and progressive rendering. A single “page load time” average would erase that mechanism.
What these experiments establish together
Controlled evidence defeats the strongest sceptical claim—“performance never changes business behaviour.” It sometimes does. It also defeats the strongest marketing claim—“every millisecond has the same monetary value.” One Bing region had measurable revenue sensitivity; another page region had no detectable effect. Google saw small engagement effects that grew with exposure. The defensible generalization is about method: manipulate performance at the task-relevant point, keep other experience elements invariant, and measure a whole-business outcome over an adequate period.
What the famous case studies actually reported
Company A/B case studies move closer to the reader’s ecommerce question, but the public reports are marketing-length summaries rather than experiment dossiers. They can support a claim that a lift occurred as reported. They rarely provide enough information to reproduce the analysis, evaluate attrition, calculate uncertainty, or transfer the magnitude.
Rakuten 24: a large result with incomplete public uncertainty
Rakuten 24 optimized one high-traffic landing page and ran a 50/50 test for a month. The article says the versions had no visual or functional difference beyond performance work. In the displayed mobile comparison, the optimized version finished loading 0.4 seconds sooner. Rakuten reported 53.37% higher revenue per visitor, 33.13% higher conversion, 15.20% higher average order value, and a 35.12% lower exit rate.1
That is direct evidence for the tested page if assignment, measurement, and analysis were valid. The public page does not give visitors, orders, baseline rates, randomization unit, exclusions, confidence intervals, or corrections for evaluating several outcomes. It also does not isolate one Web Vital: LCP, FID, FCP, TTFB, and CLS moved. “Their 33% conversion lift is not your forecast” is not scepticism for its own sake. It follows from missing transfer variables.
The same case study contains a separate RUM analysis: sessions with better LCP had higher conversion, revenue per visitor, and order value. Those bucket comparisons are useful for choosing where to test, but they are observational. Converters may browse more pages, benefit from a warm cache, use better devices, arrive through different channels, or remain long enough to record later performance events. Do not blend that analysis with the randomized estimate.
Vodafone: a better-disclosed traffic split, still one context
Vodafone sent 50% of paid traffic to an optimized landing page and 50% to baseline. Each variant received about 100,000 clicks and 34,000 visits per day. The versions were described as visually and functionally identical. Field LCP improved 31%, and Vodafone reported 8% more sales, a 15% improvement in lead-to-visit rate, and 11% higher cart-to-visit rate.2
The traffic scale and same-session LCP measurement strengthen the operational story. The missing test duration, market, assignment unit, confidence interval, absolute sales, and profit still matter. Paid landing traffic can have different intent and cache conditions from returning customers or organic product-page visitors. The result says “this landing-page treatment worked here,” not “31% better LCP produces 8% more sales everywhere.”
Farfetch: a smaller range can be more decision-useful
Farfetch joined performance and funnel data in its analytics system, then tested product-image loading changes. Product pages became more than 600 ms faster, and the company reported a 1–5% conversion uplift at its defined confidence level.5 The range is less spectacular than Rakuten’s headline, but it communicates that the effect estimate has uncertainty—even though the exact interval and design details remain private.
Farfetch also published observational slopes, including an average 1.3% conversion decline for each extra 100 ms of LCP beyond 2.5 seconds. That association should not replace the A/B range. The controlled result answers the treatment question; the observational model helps locate opportunity. Keeping them separate is the discipline this entire topic requires.
What field studies can—and cannot—show
A widely cited Google-commissioned Deloitte/Fifty-Five study analysed 30 million mobile sessions across 37 retail, travel, luxury, and lead-generation brands over roughly four weeks in late 2019. For 15 retail brands and 20.5 million sessions, a modelled 0.1-second improvement across four speed metrics was associated with 8.4% higher conversion and 9.2% higher average order value.6
The report’s methodology is explicit: Lighthouse speed readings were aggregated with hourly web analytics; fluctuations occurred naturally and were not created as treatments; a logarithmic regression related speed to funnel outcomes; and only coefficients reaching a 95% significance threshold were included. The report itself calls the findings correlations. It also says Deloitte did not audit the data, desktop parameters were contradictory, and results may not represent other sites, products, designs, economics, or seasons.
This study is valuable because it covers multiple brands, real sessions, several industries, and funnel stages. It is not causal because the faster hours may differ from slower hours in more than performance. Campaign mix, inventory, promotions, traffic geography, device composition, third-party incidents, payday, weather, and demand can move both speed and conversion. Selecting only significant brand coefficients can make the published aggregate look cleaner than the complete set of relationships.
Why session-level correlation often exaggerates certainty
- Device and network confounding: high-end devices and reliable networks improve performance and may belong to customers with different purchasing power or intent.
- Route and cache confounding: returning users and deeper sessions can receive warm-cache pages while also being more likely to convert.
- Survival bias: users who abandon before a late performance event or analytics beacon may disappear from the slowest bucket.
- Outcome leakage: pages after conversion or near checkout may be both faster and disproportionately represented among converters.
- Aggregation: an origin-level metric can mix fast editorial pages with slow revenue pages, while the business outcome occurs on only one template.
- Reverse causality through experience: a user action can trigger more JavaScript, personalization, or tracking, making valuable sessions appear slower because the user did more.
CrUX adds a different boundary. It represents eligible Chrome experiences on sufficiently popular, publicly discoverable pages and origins. It excludes unsupported populations such as Chrome on iOS, WebView, and other Chromium browsers; it strips URL parameters; and it cannot join a Web Vital to your order margin.11 The 2025 Web Almanac found good Core Web Vitals on 48% of mobile and 56% of desktop websites, with secondary pages passing more often than home pages.10 That describes the state of the web. It does not estimate a revenue curve.
Build a business case without borrowed uplift
A credible business case has three layers: observed exposure, a decision threshold, and an identification plan. It can be useful before the uplift is known because it tells the team how large an effect must be to matter and whether available traffic can measure it.
1. Define the exposed economic surface
Count only sessions that can experience the proposed change and reach the measured outcome. If the work optimizes product-detail images, exclude editorial landings that never load that component. Break the population down by device, market, new/returning user, template, acquisition channel, and cache state before choosing one headline average.
2. Use value, not vanity, as the primary outcome
Conversion rate is easy to explain but can hide lower order value, higher returns, or low-margin purchases. Revenue per eligible visitor captures conversion and order value. Contribution margin per eligible visitor is better when product margin, payment fees, fulfilment, cancellations, and returns vary materially. Declare the exact numerator, denominator, attribution window, currency treatment, and refund window before exposure begins.
3. Calculate the break-even effect
Estimate one-time engineering cost, recurring infrastructure cost, expected life, and the cost of measurement. Convert those costs into the minimum monthly incremental margin required. Divide that threshold by current margin in the eligible population. The result is the smallest relative improvement that repays the investment under the stated horizon—not the lift you expect to observe.
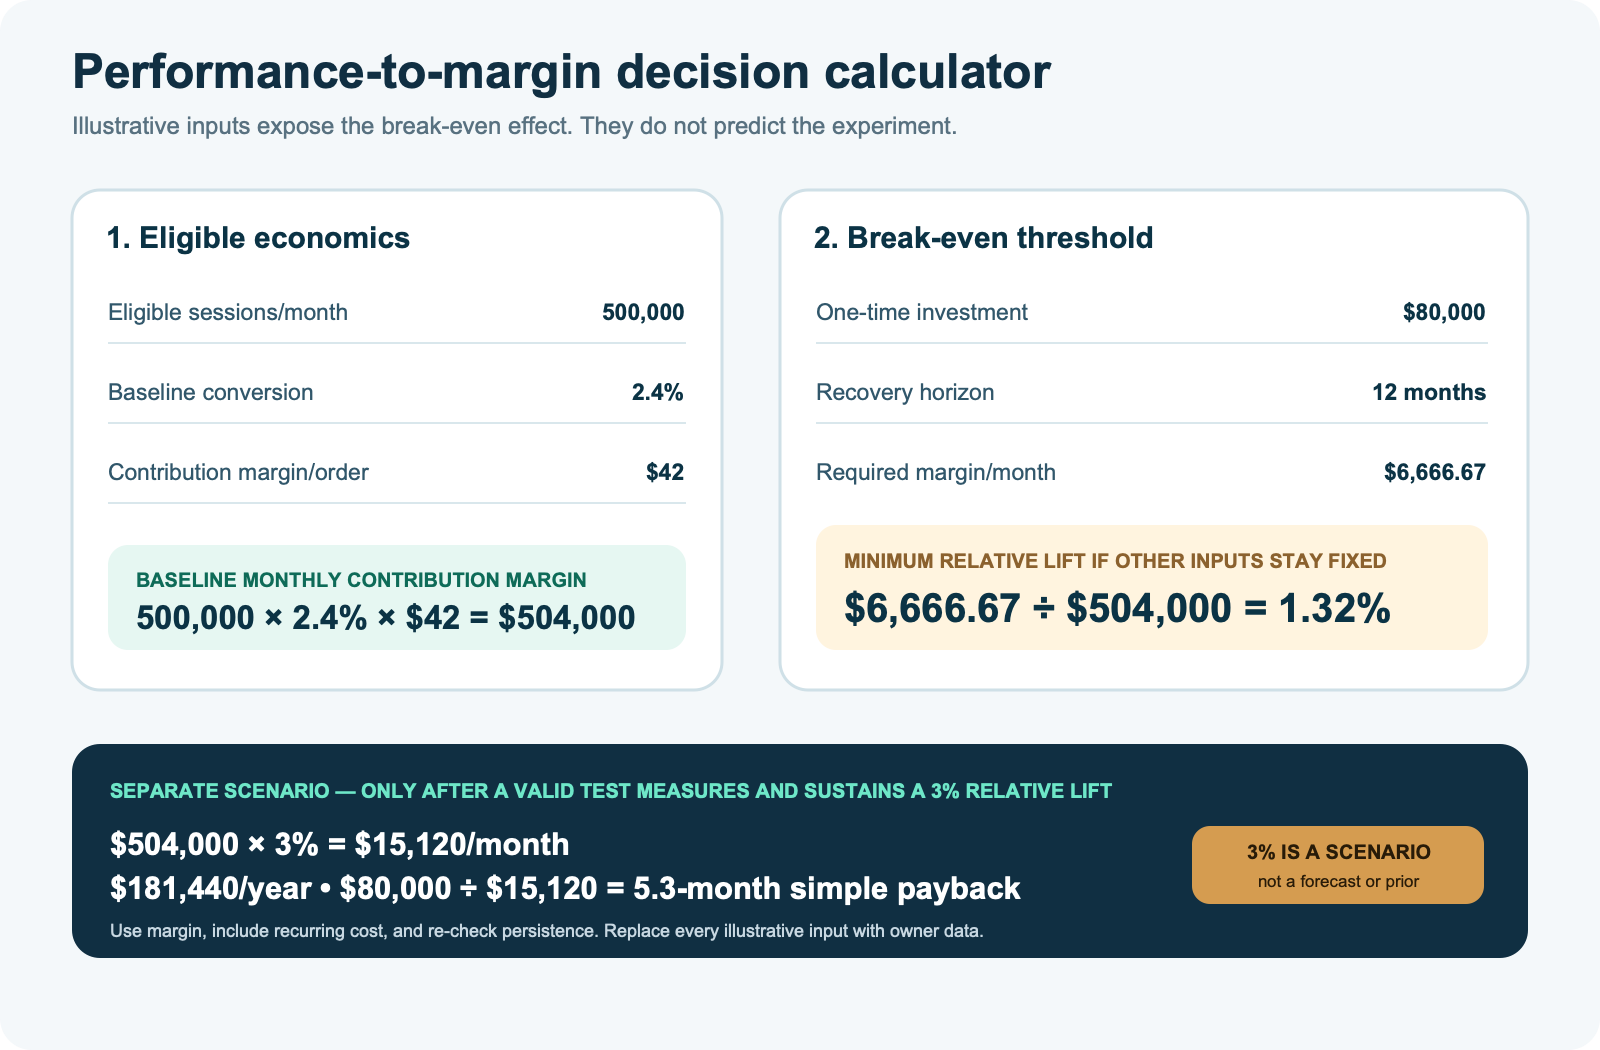
In the illustrated shop, 500,000 eligible monthly sessions × 2.4% conversion × $42 contribution margin produces $504,000 monthly contribution margin. Repaying an $80,000 investment over 12 months requires $6,666.67 per month, or a 1.32% relative lift if every other input stays fixed. A measured and sustained 3% relative lift would yield $15,120 monthly and a 5.3-month simple payback. The 3% is a scenario, not a prior borrowed from Farfetch.
4. Ask whether the effect is measurable
Revenue and margin per visitor are noisy and often heavily skewed. Power the test on the decision metric and the minimum worthwhile effect, using historical variance and the actual randomization unit. A test capable of detecting a 10% conversion lift may still be useless when the break-even effect is 1.3%. If sufficient traffic would require six months, use a phased operational decision or stronger leading metric without pretending it is final revenue evidence.
Run a performance experiment that can survive review
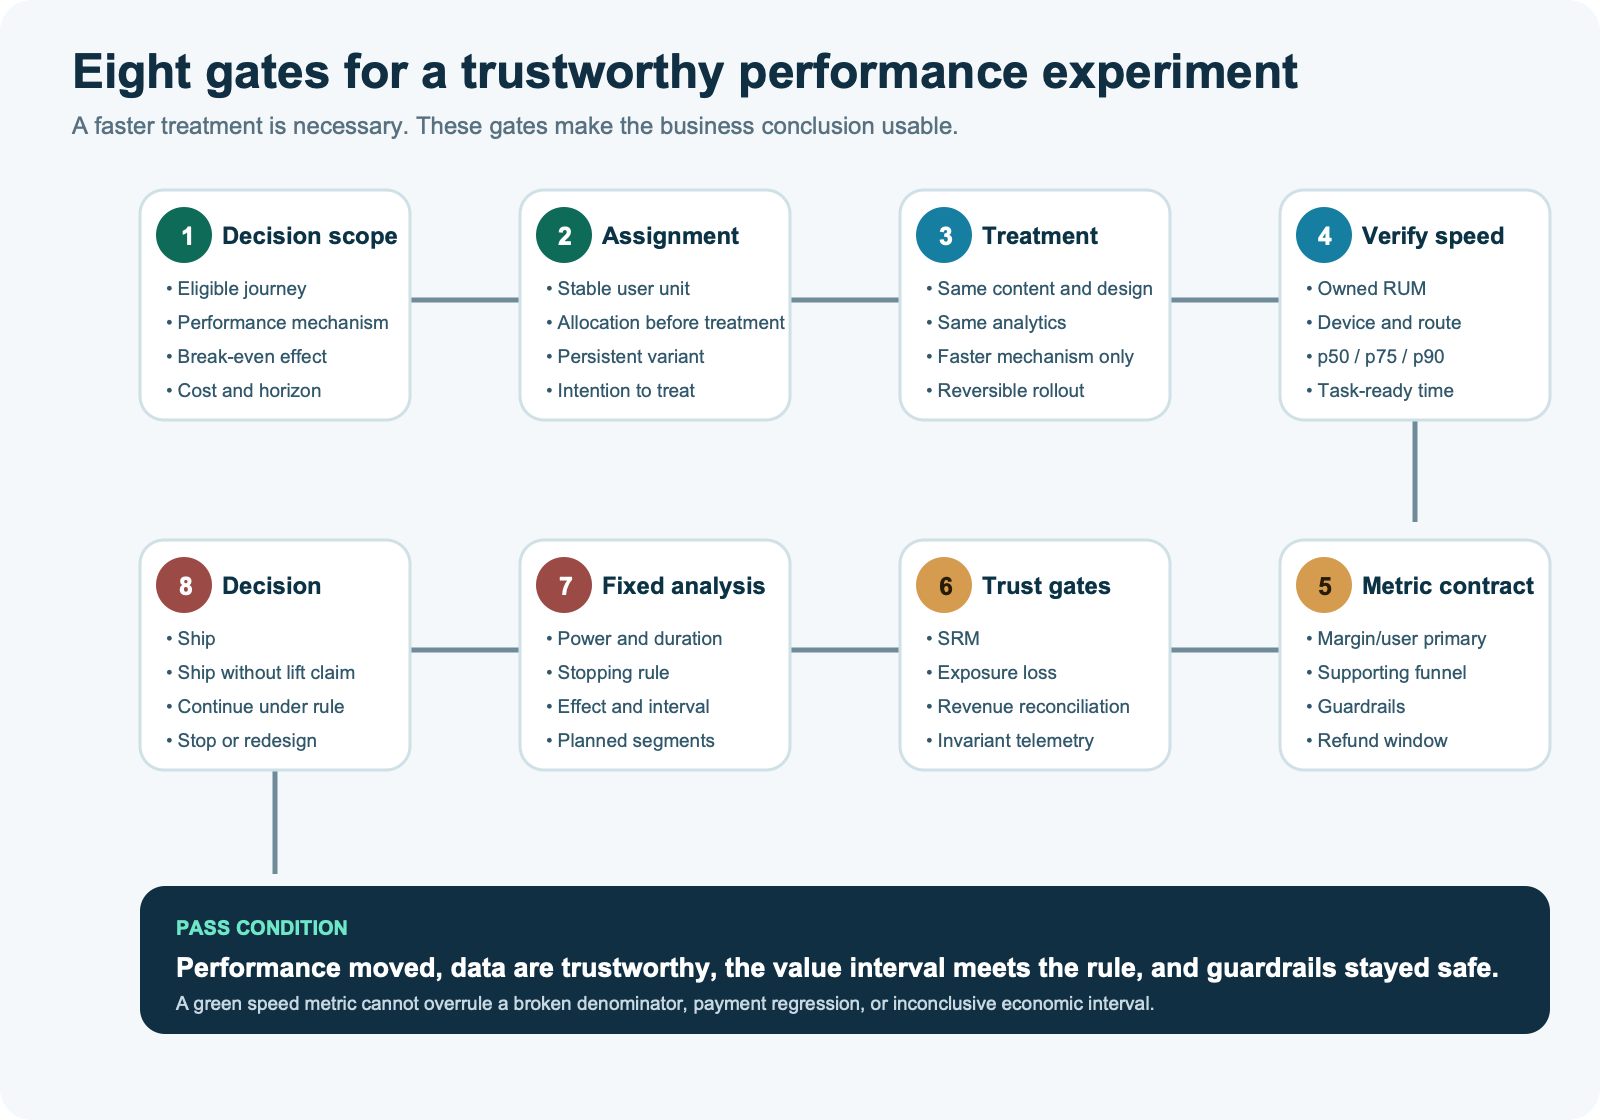
Write the intervention, not “speed,” into the hypothesis
Name the component and mechanism: “server-render the product summary and prioritize the hero image so p75 product-detail LCP falls by at least 500 ms on mobile without increasing errors or layout shift.” This makes treatment fidelity testable. It also prevents a bundle of checkout copy, image redesign, caching, and tracking changes from being attributed to speed alone.
Randomize a stable unit
User-level assignment is often appropriate because a session can span several pages and repeat visits. Keep the user in one variant, log assignment before treatment, and analyse everyone assigned—the intention-to-treat population—even if the performance improvement does not materialize on every visit. Pageview randomization can contaminate the experience through cache and learning effects. Cookie-based assignment misses cross-device users and requires a declared policy for consent and deletion.
Prove that treatment changed experienced performance
Capture LCP, INP, CLS, TTFB, route, device class, connection hints where appropriate, experiment ID, and variant in owned RUM. Use the same measurement code in both variants and load it without blocking rendering. Report distributions and percentiles rather than only means; web.dev recommends field measurement and distribution-aware reporting for exactly this reason.12 Track the task-relevant phase as well: time until product media is usable, search results are actionable, or payment confirmation appears.
Predeclare one decision metric and a small metric family
- Primary: contribution margin or revenue per eligible randomized visitor.
- Supporting: conversion, average order value, checkout completion, qualified lead, or searches per user.
- Treatment verification: p50/p75/p90 LCP, INP, TTFB, CLS, or task-ready time by device and template.
- Guardrails: JavaScript errors, HTTP failures, stock or price correctness, payment failure, cancellation/refund, accessibility, ad delivery, analytics loss, and customer support contacts.
- Long-run: repeat purchase, retention, return rate, and regression frequency where the decision horizon requires them.
Microsoft’s “Dirty Dozen” shows why metric roles matter: a local click or funnel step can improve by cannibalizing another path, a denominator can change between variants, and novelty can look like durable value.8 A green LCP result does not overrule a red payment-error guardrail.
Run data-quality gates before reading lift
Compare assigned counts with the configured allocation through a sample ratio mismatch test. SRM can arise in assignment, execution, logging, filtering, or analysis, and it can reverse the apparent result.9 Check exposure logging, duplicate IDs, bot policy, consent effects, missing performance events, revenue reconciliation, and invariant pre-treatment metrics. Do not “adjust away” an unexplained mismatch and continue.
Freeze horizon and decision rules
Choose test duration from traffic, variance, weekly cycles, expected novelty, and the minimum effect of interest. Define whether inference is frequentist, Bayesian, or sequential and follow the matching stopping rule. Record planned segments before results. Report the point estimate and interval, not only “significant” or “not significant.” An interval spanning loss and material gain means the decision remains uncertain; it does not mean speed had zero effect.
Keep search handling clean
Do not serve Googlebot a special fast or slow version. Where an experiment uses alternate URLs, Google recommends canonicalizing variants to the original where appropriate, using temporary rather than permanent redirects, and removing experiment machinery after enough data is collected.13 That guidance protects Search behaviour; it does not replace statistical design.
Worked example: the honest answer is sometimes “not yet”
Consider the illustrative shop from Figure 3. Its mobile product pages have p75 LCP of 4.1 seconds. The team can move image selection into server-rendered HTML, preload only the chosen hero, and remove a client-side carousel bootstrap. It expects a 500–800 ms LCP improvement without changing design or product information.
The contract randomizes eligible users 50/50 for four complete weeks. Primary outcome is contribution margin per eligible user with a 14-day order and refund window. Supporting metrics are conversion and average order value. Guardrails include checkout errors, missing images, add-to-cart latency, CLS, cancellation, and analytics receipt. A 1.32% relative margin lift covers the one-year cost; power calculations show the test can reliably distinguish roughly 2.5%, so the owner knows before launch that the strict break-even threshold may remain unresolved.
Suppose the treatment improves mobile product-page LCP by 700 ms and the estimated margin-per-user lift is 1.8%, with an interval from −0.6% to +4.2%. SRM and guardrails pass. Conversion moves +2.1%; order value is flat. This is not evidence of “no impact,” and it is not proof of positive ROI. The estimate is compatible with a modest loss and a valuable gain.
A defensible decision might still ship the treatment if it also reduces infrastructure work, fixes a known user-experience defect, and creates no material regression. The release note should say the performance target was achieved and business evidence was inconclusive at the minimum effect—not claim 1.8% as realized annual revenue. A larger marketplace might continue exposure or pool a predeclared second wave. A smaller shop should avoid fishing through segments until one turns green.
When randomization is unavailable
Some performance changes affect a shared CDN, origin, framework, or database and cannot safely vary by user. The next-best design is usually a staggered rollout across comparable markets, templates, or clusters, with the schedule chosen before outcomes are seen. Difference-in-differences or a synthetic control can then estimate what treated traffic would have done without the change.
Bayesian structural time-series methods can combine the pre-release history of the target with contemporaneous control series and return pointwise and cumulative uncertainty.7 The method is not a causal stamp. Controls must not receive the treatment, and their pre-treatment relationship to the target must remain credible afterward. A promotion, tracking migration, consent change, competitor incident, or stock disruption that affects target and control differently can become the “effect.”
If no convincing control exists, call the result an interrupted observation. Plot enough pre- and post-release history, mark other interventions, use negative-control outcomes, and show the counterfactual range. The evidence can support operational confidence and future test design. It should not be sold as a randomized revenue estimate.
What to do this week and observe for 30 days
This week: build the decision contract
- Select one revenue journey and one task-relevant performance bottleneck; do not start with the whole site.
- Establish mobile and desktop field distributions by template, route, market, and new/returning status. Record missing CrUX coverage rather than treating it as a pass.
- Join owned RUM to analytics with privacy review, stable experiment IDs, consent-aware collection, and documented retention.
- Define contribution value, the eligible population, primary metric, guardrails, attribution/refund window, and break-even effect.
- Estimate variance and traffic needs. If the decision-relevant effect is unmeasurable, choose a staged rollout or operational case before writing code for an A/B test.
- Implement the smallest treatment that changes performance without changing content, price, design, eligibility, or instrumentation.
- Pre-register assignment, exclusions, duration, stopping rule, segments, analysis, and ship/hold/rollback criteria.
Days 1–30: keep three ledgers
| Ledger | Watch | Change-course trigger |
|---|---|---|
| Treatment | Performance distributions, task-ready time, errors, device/template coverage | Pause when the intended performance separation is absent or a guardrail fails |
| Experiment integrity | Assignment counts, SRM, exposure loss, analytics reconciliation, bot/consent effects | Hide outcome results until unexplained data-quality failures are resolved |
| Business | Margin or revenue per eligible user, conversion, order value, refunds, repeat behaviour | Rollback on material harm; ship only under the predeclared value and uncertainty rule |
At day 30, choose among four honest outcomes. Ship: the treatment improved performance and the business interval clears the worthwhile threshold without guardrail harm. Ship for non-revenue reasons: performance and reliability improved, business evidence is inconclusive, and cost is justified without claiming lift. Continue: treatment separation and data quality are valid but uncertainty still spans the decision threshold under an approved sequential design. Stop or redesign: performance did not move, guardrails failed, the sample is biased, or the plausible business value cannot repay the change.
The strongest counterposition
The strongest objection is that experimentation can delay an obvious user benefit. Waiting weeks to prove that a broken, slow checkout harms people may sacrifice revenue, and deliberately slowing control users after a faster implementation exists can be ethically and commercially unattractive. Performance also supports accessibility, reliability on constrained networks, energy use, and product quality even when a revenue test is underpowered.
That objection is right about the decision boundary. Fix correctness failures, pathological latency, timeouts, inaccessible states, and severe regressions without demanding a revenue p-value. Use performance budgets and monitoring to prevent their return. If a safe faster treatment exists, compare it with the current experience during a bounded rollout rather than manufacturing an additional slowdown.
The objection does not justify a fabricated financial forecast. “We should fix this because the experience is unacceptable” is a valid decision. “This will add 33% conversion because Rakuten did” is not. Experiment when the unresolved decision concerns prioritization, staffing, infrastructure cost, the value of a marginal improvement, or a tradeoff with features and monetization. Do not force one method onto every performance task.
Small-site, platform, and product boundaries
For a small site
A low-traffic business may never power a revenue test for a 1–3% lift. Start with severe field problems on the highest-value templates, reproduce the bottleneck in the lab, and price the fix against a range from zero business lift to a conservative scenario. Use a phased release, analytics annotations, and repeated 30-day comparisons while clearly calling them observational. Prefer changes with reliability, accessibility, or infrastructure benefits that remain worthwhile if revenue does not move.
For a large platform
Randomize at the unit that contains cache, identity, marketplace, and cross-device spillovers. Watch interaction with ads, recommendations, consent, personalization, and other concurrent tests. Analyse heterogeneity only from predeclared segments or with appropriate shrinkage. Revenue tails may require variance reduction, capping rules, or robust estimators decided in advance. Measure persistence: Google’s latency result changed with exposure length and remained after treatment removal.
For the 2-UA boundary
Use the free Core Web Vitals checker to establish an eligible Chrome field baseline for a public URL, then use 2-UA’s ongoing Core Web Vitals, PageSpeed, and response-time monitoring to detect regressions by URL and device. That evidence can show whether real-user performance is poor, whether a release changed monitored metrics, and whether the gain persists.
2-UA does not provide event-level RUM, user randomization, ecommerce analytics joins, contribution-margin calculations, experiment power analysis, or causal inference. Those steps require the owner’s consent-aware analytics and experimentation systems. CrUX also has no order or user-level business data. The product bridge ends where the revenue claim begins.
What the evidence does not show
- It does not show a universal revenue gain per 100 ms, per LCP second, or per Core Web Vitals status change.
- It does not show that passing Core Web Vitals thresholds causes conversion or that a failing URL is unprofitable.
- It does not make the Rakuten 24, Vodafone, Farfetch, Bing, or Google result transferable to another site without a local test.
- It does not establish that every performance optimization is invisible to users; design, content, image quality, tracking, ads, and functionality can change with the implementation.
- It does not make an observational regression causal because it contains millions of sessions or a 95% significance threshold.
- It does not show that “no significant lift” means zero effect; the interval and minimum worthwhile effect determine what was ruled out.
- It does not show that revenue is the only valid reason to fix performance, reliability, accessibility, or serious user harm.
- It does not show that CrUX represents all visitors, all browsers, individual conversions, or private/authenticated journeys.
- It does not make a synthetic-control estimate valid when controls receive the treatment or the pre-release relationship breaks.
- It does not justify keeping a test live indefinitely, searching unplanned segments for a win, or suppressing guardrail harm.
Implementation checklist
Evidence and economics
- Write the business decision and the minimum worthwhile effect.
- Separate randomized results, observational associations, modelled counterfactuals, and benchmarks.
- Use contribution margin per eligible user when revenue quality varies.
- Label borrowed case studies as motivation, never as a forecast.
Treatment and measurement
- Change one performance mechanism while holding experience and telemetry invariant.
- Verify the treatment in owned RUM by device, route, template, and percentile.
- Use stable assignment and analyse the intention-to-treat population.
- Predeclare primary, supporting, treatment-verification, guardrail, and long-run metrics.
Trust and analysis
- Run SRM and telemetry reconciliation before viewing outcome lift.
- Freeze duration, stopping rule, attribution window, exclusions, and segments.
- Report absolute baselines, relative and absolute effects, intervals, and denominators.
- Keep “inconclusive” available as a legitimate result.
Release and learning
- Protect Search with non-cloaked variants, temporary redirects where needed, and clean removal.
- Roll out gradually and keep performance plus business guardrails after the test.
- Record which population, baseline, journey, and implementation the estimate belongs to.
- Re-test when those conditions change materially; do not turn one local estimate into a permanent law.
Primary sources and research
- Rakuten 24 / Google web.dev, “How Rakuten 24's investment in Core Web Vitals increased revenue per visitor by 53.37% and conversion rate by 33.13%”, updated August 24, 2022; reviewed September 25, 2026. First-party company A/B case study and observational RUM analysis.
- Vodafone / Google web.dev, “Vodafone: A 31% improvement in LCP increased sales by 8%”, March 17, 2021; reviewed September 25, 2026. First-party company A/B case study.
- Ron Kohavi, Alex Deng, Roger Longbotham, and Ya Xu, “Seven Rules of Thumb for Web Site Experimenters”, KDD 2014. Peer-reviewed industrial controlled-experiment research.
- Jake Brutlag, Google, “Speed Matters for Google Web Search”, June 22, 2009. First-party controlled field-experiment report.
- Farfetch / Google web.dev, “Luxury retailer Farfetch sees higher conversion rates for better Core Web Vitals”, reviewed September 25, 2026. First-party company analytics and A/B case study.
- Deloitte Digital, Google, and Fifty-Five, “Milliseconds make Millions”, 2020. Commissioned multi-brand observational regression study.
- Kay H. Brodersen et al., “Inferring causal impact using Bayesian structural time-series models”, Annals of Applied Statistics 9(1), 2015, DOI 10.1214/14-AOAS788. Peer-reviewed methods research.
- Pavel Dmitriev, Somit Gupta, Dong Woo Kim, and Garnet Vaz, “A Dirty Dozen: Twelve Common Metric Interpretation Pitfalls in Online Controlled Experiments”, KDD 2017. Peer-reviewed industrial research.
- Aleksander Fabijan et al., “Diagnosing Sample Ratio Mismatch in Online Controlled Experiments”, KDD 2019, DOI 10.1145/3292500.3330722. Peer-reviewed industrial research.
- Himanshu Jariyal, Prathamesh Rasam, Humaira, Aaron T. Grogg et al., HTTP Archive, “Performance”, 2025 Web Almanac, published January 15, 2026 and updated May 5, 2026. Independent community observational data.
- Chrome UX Report, “CrUX methodology”, reviewed September 25, 2026. First-party dataset documentation.
- Philip Walton, Google web.dev, “Best practices for measuring Web Vitals in the field”, reviewed September 25, 2026. First-party platform measurement guidance.
- Google Search Central, “Minimize A/B testing impact in Google Search”, updated December 10, 2025; reviewed September 25, 2026. First-party search platform guidance.