Your homepage passes Lighthouse. Total Blocking Time is 140 milliseconds. The release gate is green. Yet mobile customers still tap “Apply filters” twice because the product grid appears frozen, and the Core Web Vitals report labels a group of product-listing URLs “needs improvement.” The team reruns Lighthouse on the homepage, removes a small script from startup, and watches TBT fall again. Nothing changes for the users who reported the problem.
This is not a contradiction between a correct lab test and an unreliable field metric. It is a scope error. The lab loaded one public route, with one device profile, one network profile, an empty cache, no account state, and no human journey. The slow interaction occurred later, on a secondary page, after filters, analytics, personalization, and application state were active. A load audit never pressed the control at the moment real people did.
Interaction to Next Paint (INP) replaced First Input Delay as a Core Web Vital on March 12, 2024.11 Two years later, the most valuable lesson is not a new threshold or optimization trick. It is an evidence architecture: aggregate field data finds the affected population, event-level RUM finds the slow interaction and latency phase, and a controlled lab trace explains the code. Treating any one layer as the whole answer produces confident work on the wrong page.
What INP actually reports
INP observes qualifying click, tap, and keyboard interactions across the life of a page. For most visits it reports the interaction with the longest latency. On pages with many interactions, the algorithm ignores one highest-latency interaction for every 50 interactions, limiting the influence of incidental outliers. The page or origin’s Core Web Vitals classification is then based on the 75th percentile of page visits, separated by mobile and desktop: 200 milliseconds or less is “good,” above 200 through 500 milliseconds “needs improvement,” and above 500 milliseconds is “poor.” 1
Those two levels of selection are easy to collapse. INP is not the average duration of all handlers. It is not the 75th percentile of every raw click pooled together. It is a near-worst interaction within each eligible visit, summarized across visits. A route whose median click is fast can still have poor INP if a meaningful share of visits contains one costly interaction. Conversely, a page with abundant background work may retain good field INP if people rarely interact while that work blocks the main thread.
The underlying Event Timing API measures from the input event timestamp until the browser completes the rendering update after event dispatch. Related
events in one logical gesture can share an interactionId. The API exposes processingStart and processingEnd, while
Chrome’s web-vitals attribution build turns the timing into three diagnostic phases: input delay, processing duration, and presentation
delay.23 Event Timing remains a W3C draft, and its duration is rounded to 8-millisecond
granularity. Target and detailed attribution availability are implementation-dependent, so instrumentation must tolerate missing fields.
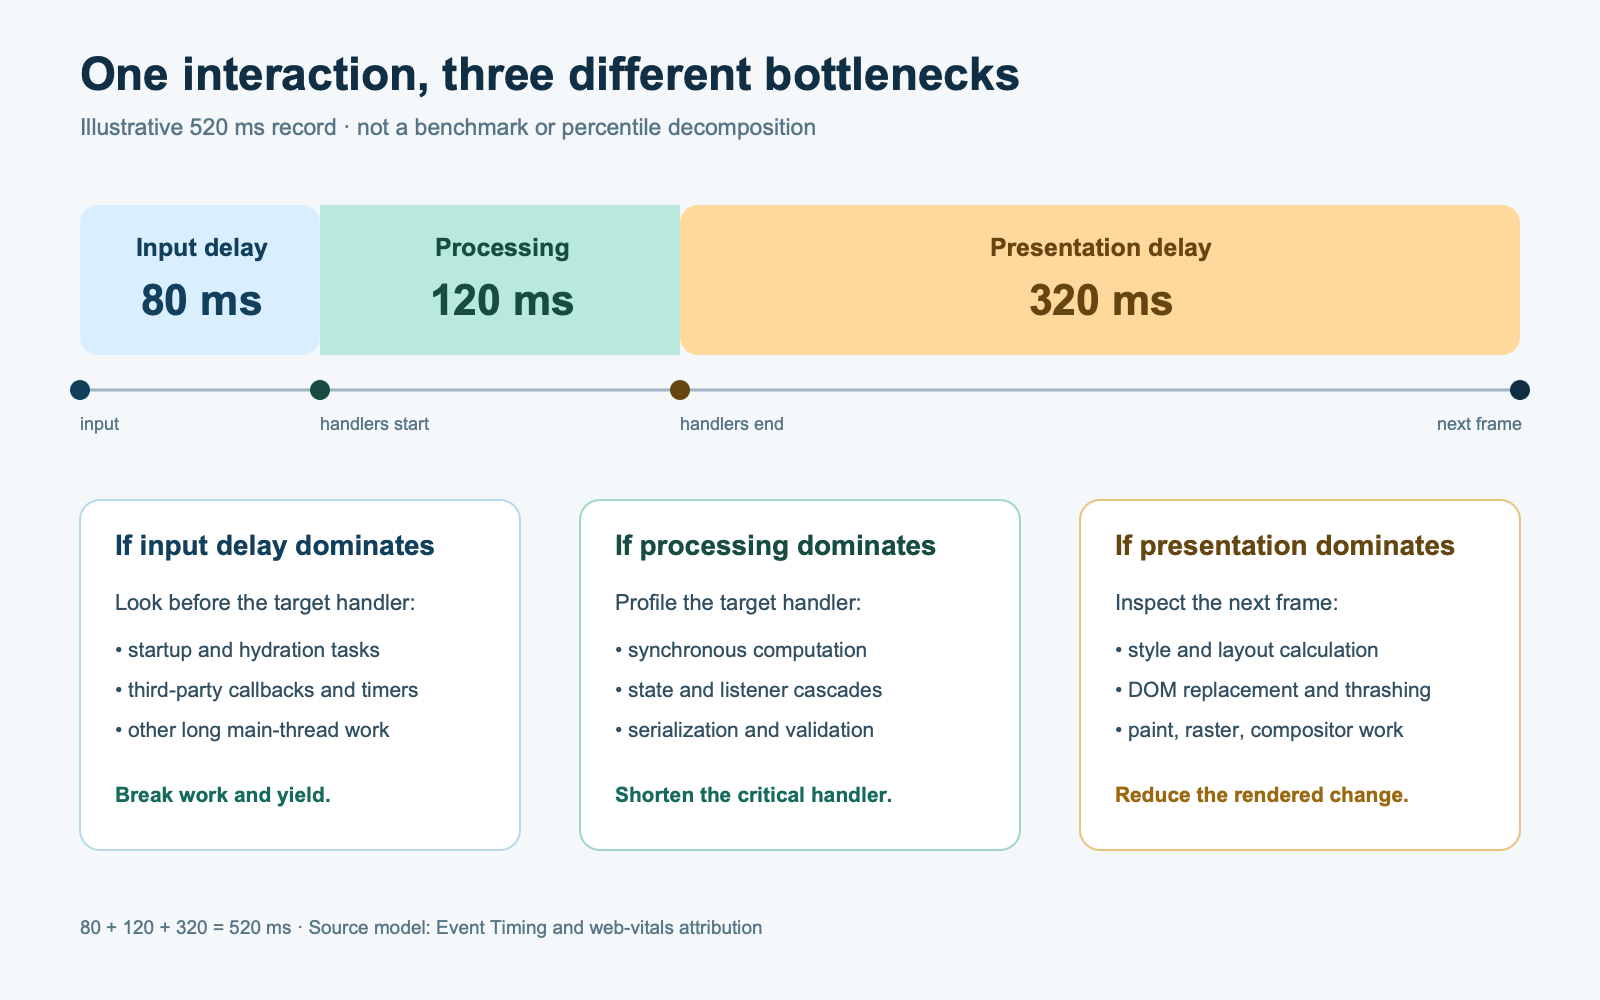
Input delay runs from the input timestamp until event processing begins. It often means that earlier work occupied the main thread: startup JavaScript, a third-party callback, another event, or a long task unrelated to the control the user touched. Processing duration covers the event listeners. Heavy calculation, synchronous state propagation, serialization, or a chain of handlers belongs here. Presentation delay begins after event processing and ends at the next presented frame. Style recalculation, layout, rendering callbacks, paint, raster, and compositor work can contribute.4
“Reduce JavaScript” is therefore too broad to be a diagnosis. A smaller bundle might reduce input delay during load yet leave a filter handler that rebuilds 4,000 DOM nodes. Memoizing a handler might reduce processing while a large style and layout update still dominates presentation. The useful unit is not the metric alone; it is route × target × interaction type × dominant phase × context.
What the 2025 field data says—and what it cannot say
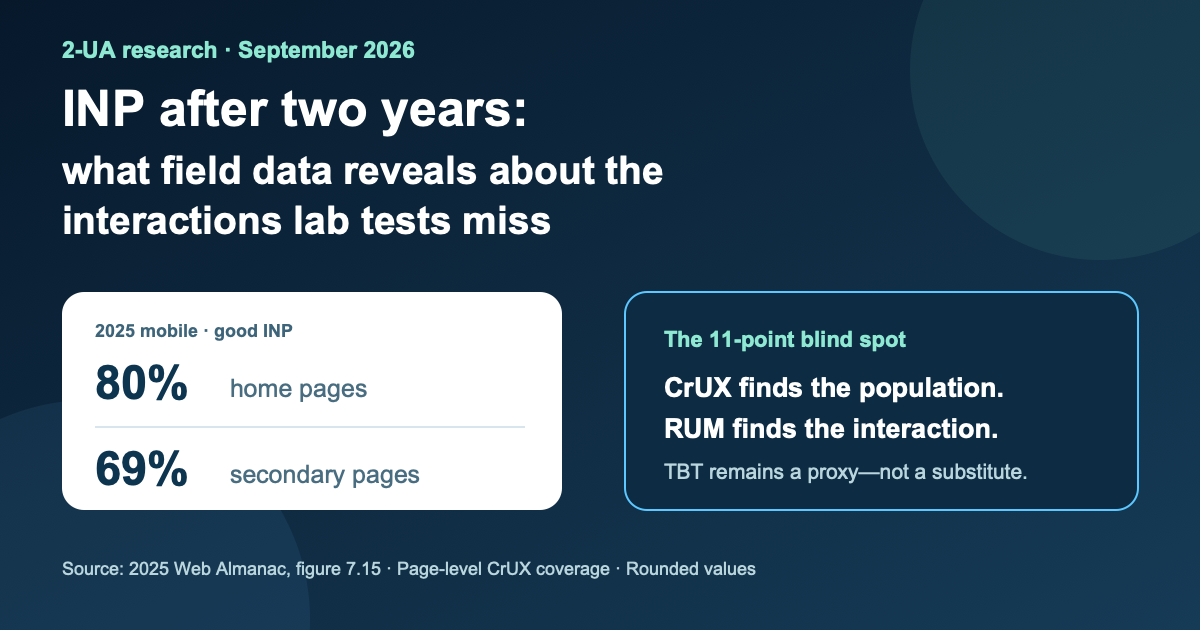
The 2025 Web Almanac combined HTTP Archive’s controlled crawl with Chrome UX Report field distributions. At origin level, 97% of desktop origins and 77% of phone origins in the analysis had “good” INP, a 20-percentage-point difference. The page-level split is more actionable: 97% of desktop home pages and 80% of mobile home pages were good, compared with 95% of desktop secondary pages and 69% of mobile secondary pages. 5
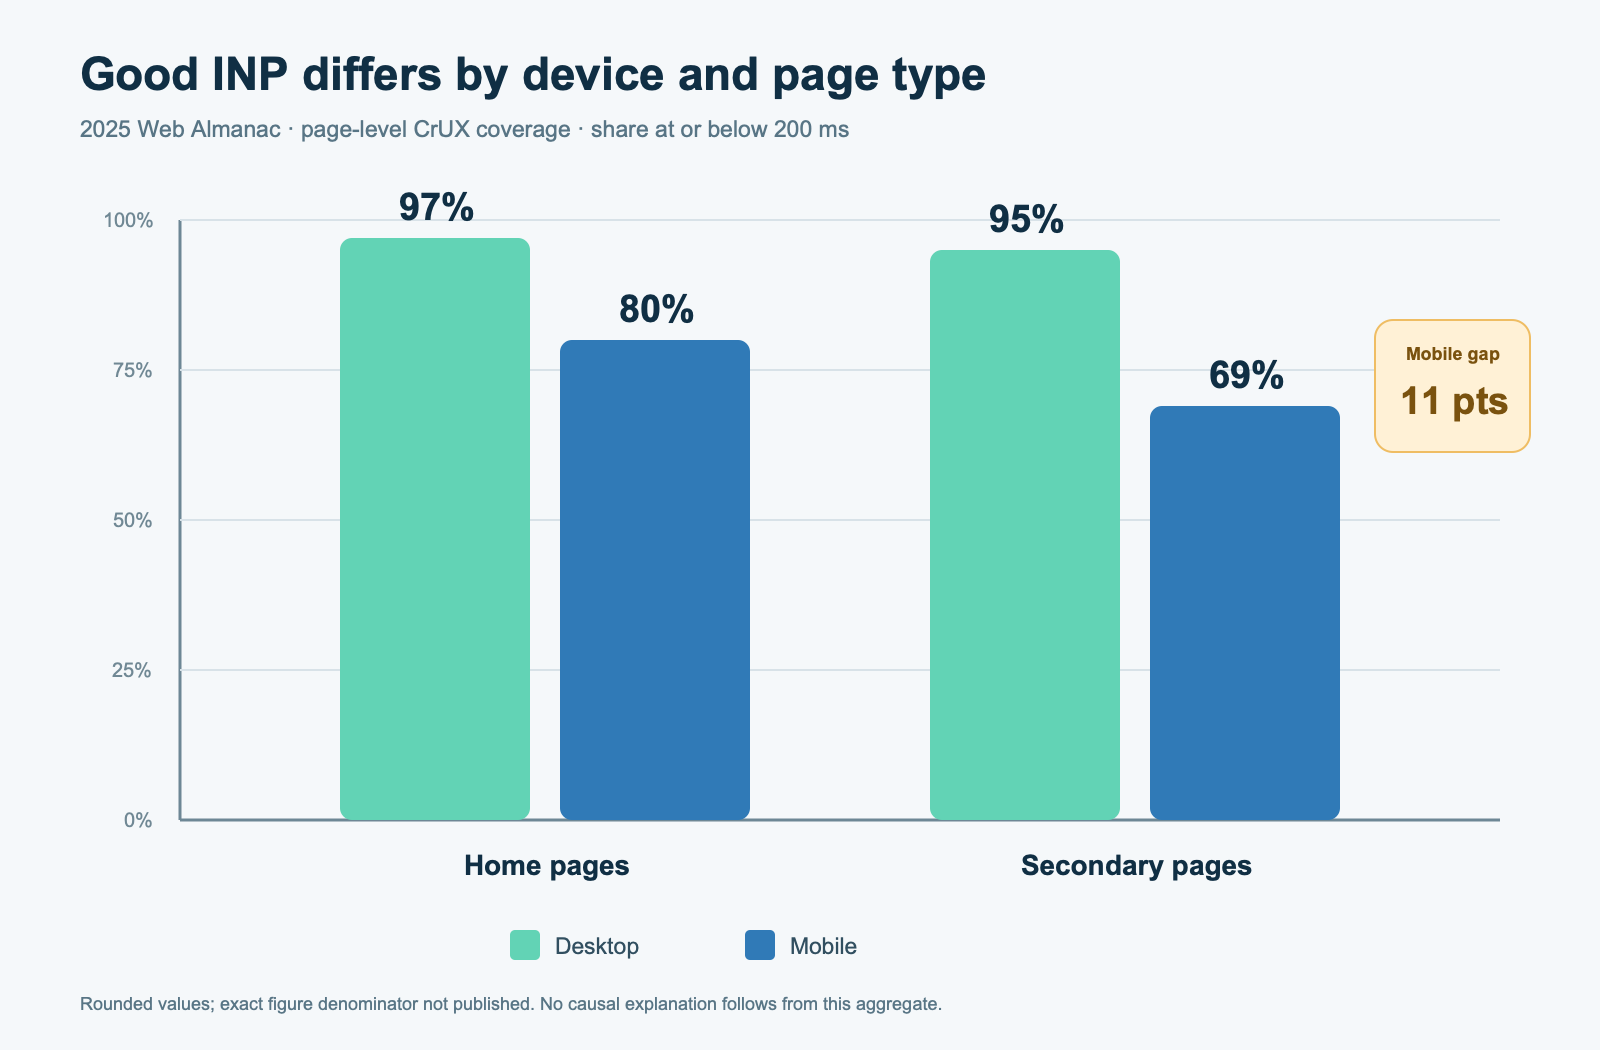
The calculated device gap was 17 points on home pages and 26 points on secondary pages—nine points wider beyond the homepage. On mobile, home pages improved from 73% good in 2024 to 80% in 2025, while secondary pages moved from 72% to 69%. The result does not prove that teams optimized homepages at the expense of inner templates. It does not prove that filters, forms, or third parties caused the difference. Page mix, CrUX eligibility, user mix, devices, browser changes, implementation changes, and sampling can all move an observational aggregate.
It does justify a decision: stop using the homepage as the sole performance representative. Build a page-type inventory and check the routes where people perform work—search results, product lists, product detail pages, account screens, checkout steps, article tools, and lead forms. The aggregate points to a blind spot; owned RUM must identify its mechanism.
The same annual report offers a sharper warning against substituting TBT for INP. Mobile origins with good INP increased from 74% to 77%, yet median mobile TBT in the synthetic tests rose from 1,209 to 1,916 milliseconds, a recalculated increase of 58.48%, reported as 58% by the authors. Field INP improved while the lab proxy worsened.5 That divergence does not make TBT useless or INP superior in every workflow. The measurements have different scopes: TBT observes main-thread blocking during a controlled load; INP observes latency when eligible Chrome users actually interact throughout their visits.
Use four evidence layers, not one score
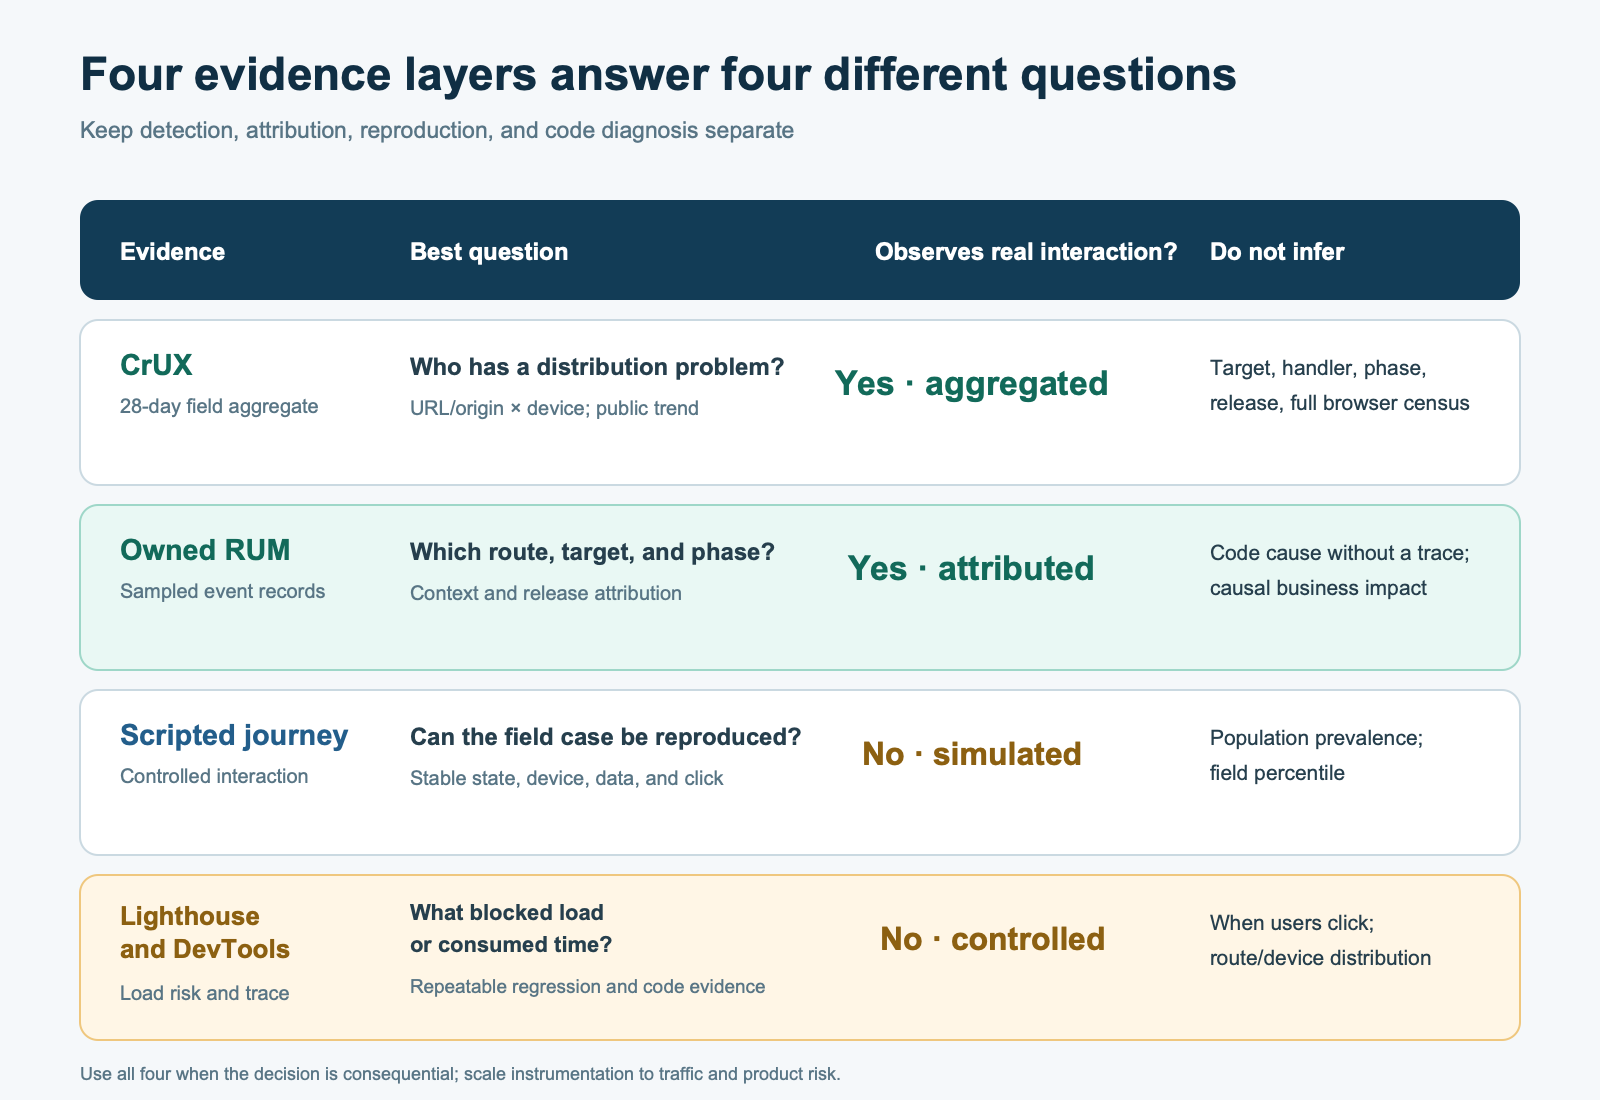
A practical INP workflow gives each measurement layer one job. CrUX answers whether a public page or origin has a sufficiently sampled field problem. Owned RUM answers where, when, and for whom the slow interaction occurred. A scripted lab journey answers whether the problem is reproducible under a controlled state. A DevTools trace answers which tasks, functions, and rendering work consumed the time. None is a replacement for the others.
Layer 1: CrUX for population-level detection
The CrUX API can return INP histograms and p75 for a URL or an origin, optionally segmented as phone, tablet, or desktop. Each API record represents a rolling 28-day aggregate and is refreshed daily on a best-effort schedule.6 This makes CrUX suitable for baselines, public comparisons, device gaps, and trend confirmation after enough time has passed.
Its limits matter. Page-level data requires public discoverability and enough eligible traffic; the popularity threshold is not disclosed. Included users must meet Chrome telemetry criteria. Chrome on iOS, Android WebView, and other Chromium browsers are excluded. Query strings and fragments are stripped, which can combine distinct application states. In a single-page application, route transitions may remain attributed to the initial page view.7 CrUX tells you that an eligible population had a problem. It cannot tell you that the problem was the color selector after a shopper chose size “M.”
Layer 2: owned RUM for interaction attribution
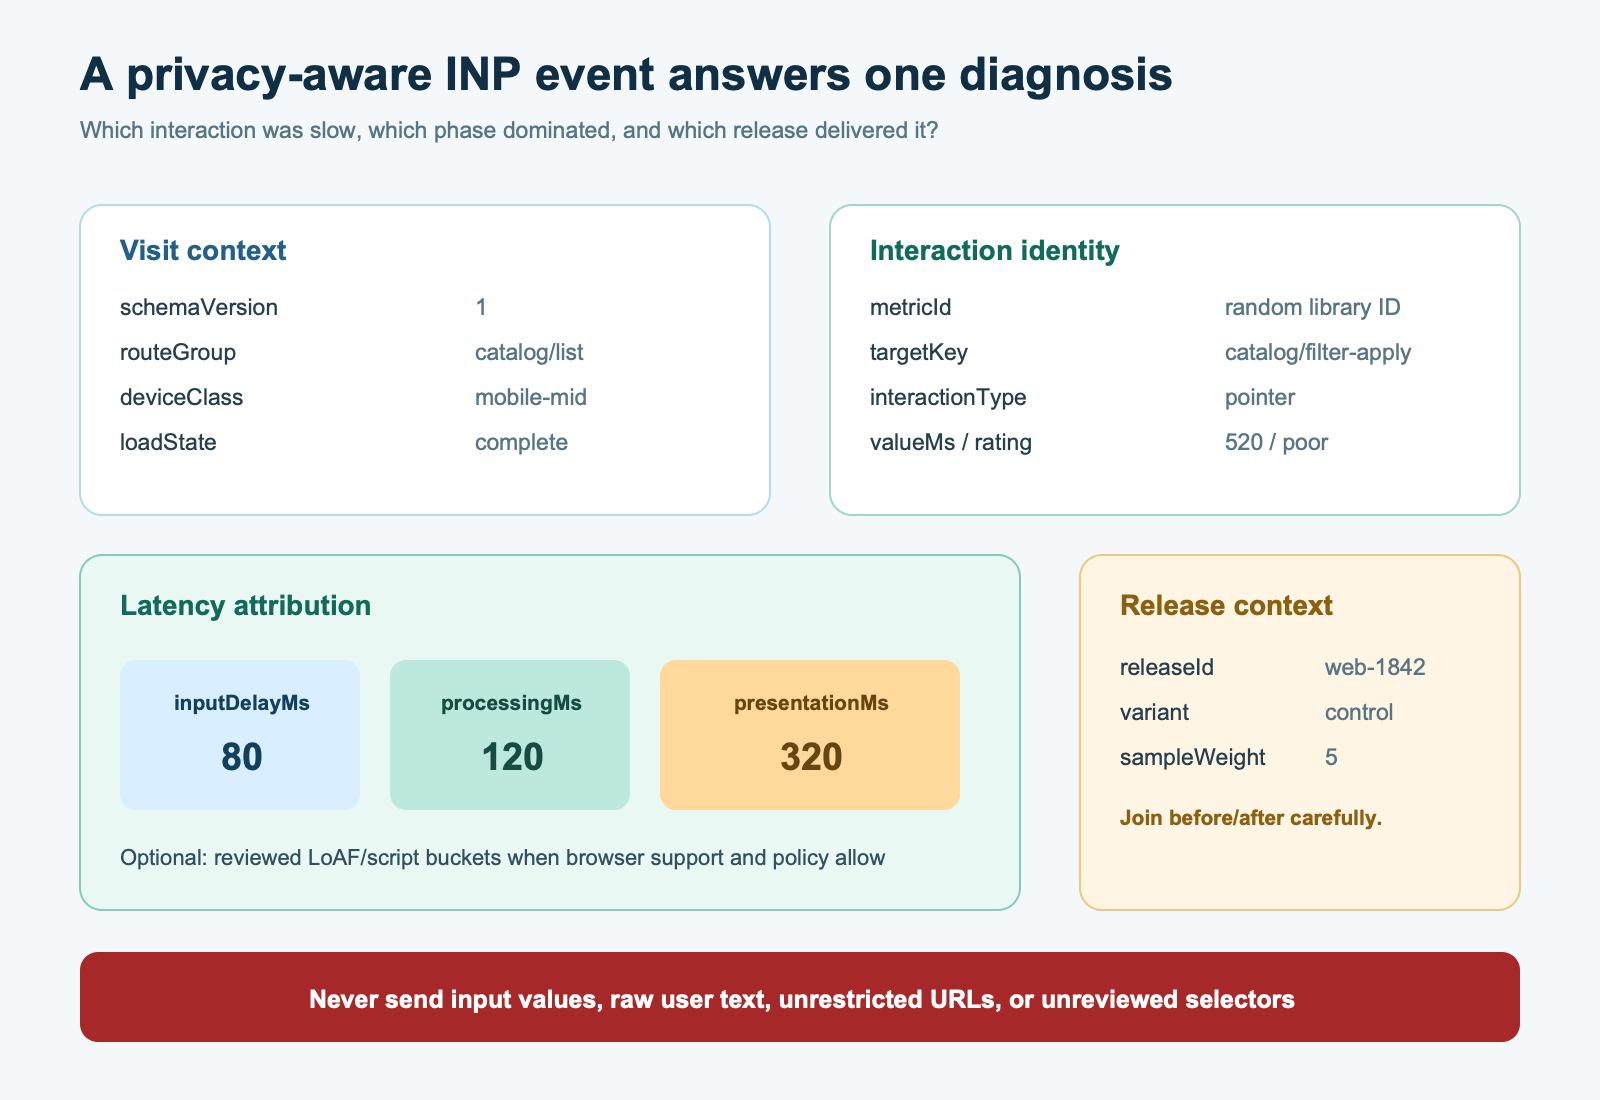
Load the attribution build of the current web-vitals library and send a compact record to an endpoint governed by your consent, retention,
and security rules. The library exposes the metric value and rating, the interaction target and type when available, input delay, processing duration,
presentation delay, load state, and—in supporting browsers—Long Animation Frame and script attribution.312
Do not ship raw element text, form values, unrestricted URLs, or every generated selector. A target such as button:nth-child(17) is unstable
and high-cardinality; a button label can contain translated, personalized, or user-generated text. Give important controls a reviewed analytics key,
such as catalog/filter-apply, cart/add, or checkout/payment-submit. Strip query strings, group routes into templates,
cap unknown values, and sample consistently. The diagnostic value comes from stable joins, not exhaustive collection.
import {onINP} from 'web-vitals/attribution';

onINP((metric) => {
  const a = metric.attribution;
  const body = JSON.stringify({
    schemaVersion: 1,
    metricId: metric.id,
    valueMs: Math.round(metric.value),
    rating: metric.rating,
    routeGroup: window.__routeGroup,
    releaseId: window.__releaseId,
    targetKey: normalizeTarget(a.interactionTarget),
    interactionType: a.interactionType,
    inputDelayMs: Math.round(a.inputDelay),
    processingMs: Math.round(a.processingDuration),
    presentationMs: Math.round(a.presentationDelay),
    loadState: a.loadState,
  });

  navigator.sendBeacon('/rum/web-vitals', body);
});
This example is a starting schema, not a drop-in compliance solution. window.__routeGroup, window.__releaseId,
normalizeTarget(), authentication boundaries, sampling, rate limits, deletion, and consent are application responsibilities. Keep the
collector separate from the application bundle where practical, and verify that failures in analytics cannot break the product.
Layer 3: scripted journeys for reproducibility
Once RUM names a route, target, and context, reproduce that path. A useful journey might load a product-list page on an emulated mid-tier mobile CPU, open the size filter after the page settles, select three values, and apply them with the same number of visible products found in the field segment. Repeat the interaction enough times to see variance, and capture both a performance trace and a visible response assertion.
Synthetic interaction timing still is not field INP. It has a controlled device, network, cache, account, dataset, and click moment. That limitation is its advantage for debugging and regression tests. When the same release changes one mechanism and the script’s trace changes accordingly, engineers get fast feedback. When a field distribution changes over weeks, owners learn whether the fix reached the users and routes that mattered.
Layer 4: Lighthouse and DevTools for load risk and code
Keep Lighthouse TBT in continuous integration. It catches startup regressions, excessive synchronous execution, and long load tasks under a repeatable profile. A poor TBT result is a reason to inspect the main thread; a good result is not evidence that every later interaction is responsive. Google’s own lab-versus-field guidance is explicit that TBT cannot know when users choose to interact. If users wait until startup work finishes, TBT can be high while INP remains low. If they interact during a gap that the lab did not exercise, INP can be poor while the one Lighthouse load looks healthy. 8
A reusable INP diagnosis framework
Use a five-step loop: segment, identify, decompose, reproduce, verify. It prevents a field metric from becoming a vague engineering backlog and prevents a lab trace from becoming a claim about users it did not observe.
- Segment: compare mobile and desktop, route groups, templates, release windows, authentication state, and meaningful device tiers. Require a minimum record count and show it beside every percentile.
- Identify: rank stable target keys by affected visits, not by the single slowest sample. Inspect both prevalence and latency so a rare 2-second click does not automatically outrank a 350 ms control used by half of customers.
- Decompose: calculate which phase dominates each interaction record. Do not add independently calculated p75 phase values and call the sum p75 INP; percentile components may come from different visits.
- Reproduce: turn the affected route, state, target, and interaction type into a scripted lab journey. Capture the trace that demonstrates the suspected mechanism.
- Verify: ship one bounded change, preserve the lab regression test, annotate the release, and observe the comparable field segment for a full window.
A prioritization table needs at least four columns: affected-visit count, p75 INP, share above 200 milliseconds, and dominant phase. Add business criticality as an explicit editorial weight—not as a fake universal score. A checkout submission used by 8% of sessions can deserve priority over a navigation control used by 40%, but that is a product decision informed by performance data, not an INP formula.
Worked example: the filter that the homepage test never touched
Consider a hypothetical ecommerce site with an origin-level mobile CrUX p75 INP of 248 milliseconds. The homepage Lighthouse run reports 140 ms TBT, so the team initially cannot reproduce the field warning. It adds privacy-reviewed RUM at a 20% session sample and records 18,400 mobile page visits over seven days. Of those, 12,600 visits produce a usable INP record; the rest have no qualifying interaction, lack supporting attribution, or end before a record is delivered. The dashboard never silently treats missing INP as zero.
Segmenting changes the story. Mobile homepage visits report p75 INP of 176 ms. Product-detail pages report 208 ms. Product-listing pages report 544 ms,
and 41% of their usable records exceed 500 ms. Among the product-list records above 200 ms, catalog/filter-apply is the attributed target in
61%. The team now has a route, a control, and an affected population—not just an origin score.
A representative 520 ms record contains 80 ms input delay, 120 ms processing, and 320 ms presentation delay. This one trace is not the route percentile; it is an example selected from the dominant target cluster. The phase sum is checked: 80 + 120 + 320 = 520. Presentation accounts for 61.54% of this record, so the first investigation is not bundle transfer or the click handler’s calculation. The scripted journey shows the handler replacing the entire result subtree, followed by style recalculation and layout for 2,400 nodes before the pressed state becomes visible.
The team changes the interaction so the button state paints immediately, updates only changed result rows, and yields non-urgent analytics work. It records a trace assertion for the filter journey and keeps the homepage Lighthouse budget. During a 30-day observation, it compares the same route group, device tier, release, and target key. A plausible success rule is: at least 3,000 usable mobile product-list visits, p75 below 300 ms, fewer than 10% of records above 500 ms, no increase in filter errors, and no material fall in filter completion. These are internal decision thresholds, not Google standards.
Even if the distribution improves, the team should say the release is associated with the measured change, not that faster INP caused more sales. Traffic mix, catalogue size, campaigns, devices, and user intent can change during 30 days. A causal conversion claim would require an experiment or a stronger quasi-experimental design with business metrics and guardrails.
Choose the fix from the dominant phase
When input delay dominates
- Find long tasks that begin before the interaction, including startup hydration, timers, third-party callbacks, and analytics serialization.
- Break work into smaller tasks and yield so high-priority interaction work can run; verify sequencing and browser support for the scheduling primitive you choose.
- Delay non-essential work, reduce repeated initialization, and avoid attaching expensive global handlers to every route.
- Segment by load state. An interaction during document loading is a different problem from the same target after the page is complete.
When processing duration dominates
- Profile the actual target’s handlers and the promises or framework updates they trigger.
- Remove unnecessary synchronous work from the critical response; calculate later when the result is not required for the next frame.
- Move suitable CPU-heavy computation to a worker, while accounting for transfer and serialization costs.
- Give immediate visual feedback before starting work that may cross a frame, but never show a false completion state.
When presentation delay dominates
- Inspect style recalculation, layout, paint, and rendering callbacks in the slow frame rather than assuming JavaScript execution is the only cost.
- Reduce the DOM changed by the interaction, virtualize large result sets where accessible, and avoid read/write layout thrashing.
- Contain layout where appropriate, simplify expensive selectors and effects, and verify that the visual response appears in the next useful frame.
- Test with realistic content volume. A ten-row fixture will not reproduce the cost of a 2,400-node update.
Long Animation Frame attribution can narrow this work further by exposing script source, invoker, function, blocking duration, and style/layout timing in supporting browsers.3 Treat missing LoAF data as missing—not as evidence that no long frame occurred. Keep a fallback path based on the three INP phases and reproducible traces.
The strongest counterposition: TBT already correlates with INP
The reasonable objection is economic: instrumentation, storage, privacy review, dashboards, and sampling all cost money. TBT is cheap, deterministic, available in Lighthouse, and often correlated with responsiveness. A small site may be better served by fixing obvious long tasks and moving on than by building a telemetry platform.
That position survives part of the evidence. TBT is an excellent prevention signal for load regressions. If a representative scripted journey shows a two-second startup task on the same low-end device class that struggles in the field, removing the task is sensible even before perfect attribution. For a low-traffic brochure site with no CrUX page record and three simple controls, manual interaction traces plus a small synthetic suite may be the proportionate answer.
It does not survive as a claim of equivalence. TBT does not select the moment of real input, observe the remainder of a long-lived visit, identify the target, capture authenticated application state, or represent the distribution of users and devices. The 2025 aggregate moved in opposite directions for mobile good-INP share and median TBT. Correlation can make a proxy useful; it cannot give the proxy the missing observables.
The balanced policy is therefore tiered. Keep TBT and scripted journeys for every site. Use CrUX when eligible. Add event-level RUM when aggregate field evidence is bad or unstable, when the page has consequential interactions, or when the team cannot reproduce the affected segment. Instrument only the fields and sampling rate required to make the next decision.
Boundaries for small sites and large platforms
A small site should not copy the storage architecture of a marketplace. Start with PageSpeed Insights or the CrUX API at origin level, test the few important interactions manually on real mobile hardware, and add a lightweight sampled beacon only if attribution is necessary. If page-level CrUX is absent, that means insufficient eligible data—not a pass. Report “no field record,” not “0 ms INP.”
A large platform needs stronger controls. Define a versioned event contract, route taxonomy, approved target keys, bot and internal-traffic filtering, consent behavior, sampling weights, retention, deletion, and schema-change monitoring. Store numerator and denominator beside percentiles. Keep release IDs and experiment assignments so distributions can be compared without mixing variants. Set cardinality budgets; an unbounded target selector or URL dimension can make the dataset expensive and analytically useless.
Neither scale removes the need for judgment. A mostly static article and an in-browser design application should not receive identical interaction budgets or telemetry investment. The Core Web Vitals threshold is a common external classification. Your product must also define task-specific response expectations, error guardrails, accessibility behavior, and business criticality.
A 30-day measurement plan
- Days 1–3—scope: inventory route groups and the five to ten controls tied to important tasks. Record CrUX URL and origin values separately for phone and desktop, including “no data.” Define privacy ownership and approved target keys.
- Days 4–7—instrument: deploy a sampled, versioned RUM event. Validate phase sums within rounding tolerance, missing-field handling, record delivery on page hide, cardinality caps, exclusion rules, and denominators.
- Days 8–12—rank: identify route-target clusters by affected visits, p75 INP, share above 200 and 500 ms, dominant phase, load state, and release. Pick one consequential, sufficiently sampled cluster.
- Days 13–17—reproduce: create a scripted journey with realistic state and content volume. Capture a baseline trace, name the mechanism, and add a regression assertion that fails for the right reason.
- Days 18–21—change: ship one bounded fix through the normal release process. Annotate the release ID and preserve functional, visual, accessibility, and error-rate guardrails.
- Days 22–30—verify: compare the same cohort and route-target cluster. Watch the full distribution and record count, not only p75. Keep the change when the predefined target improves without guardrail regressions; investigate mix changes when the lab trace improves but the field distribution does not.
Thirty days aligns with CrUX’s rolling window for public confirmation, but owned RUM can surface directional evidence earlier. Do not stop the observation as soon as one daily chart crosses 200 ms. Rolling windows contain old and new visits; campaign and device mix shift; sparse targets remain noisy. Write the minimum usable sample and decision rule before opening the after chart.
What you can do this week
- List your top five user tasks and the route and control that completes each one.
- Check URL-level and origin-level CrUX separately on phone and desktop; mark unavailable records honestly.
- Run Lighthouse on representative secondary routes as well as the homepage, and keep TBT as a load-time regression signal.
- Capture one manual DevTools trace for each critical interaction on realistic mobile hardware or an explicit emulation profile.
- If field evidence and lab evidence disagree, add a narrowly sampled attribution event with route group, stable target key, interaction type, three phases, load state, and release ID.
- Choose one cluster and define the 30-day keep, revise, or revert rule before implementing its fix.
Where 2-UA fits—and where it stops
The boundary is useful. A public field trend can tell an SEO or product team where to ask for engineering evidence; it cannot identify a handler or
prove an optimization. Pair monitoring with the route-target-phase schema above. A reader who never uses 2-UA can follow the same workflow with the
CrUX API, the web-vitals library, their analytics stack, and controlled traces.
What the evidence does not show
- The 2025 Web Almanac does not establish why mobile secondary pages had a lower good-INP share, and its chapter does not publish the figure-specific denominator.
- The opposite movement of mobile INP and TBT does not prove that either metric is wrong, that one caused the other, or that the same individual pages moved in opposite directions.
- CrUX is not a census of every browser, page, or user. Eligibility, telemetry, URL grouping, and SPA attribution shape the reported population.
- A good INP classification does not guarantee that every interaction is fast, that users are satisfied, that conversions will rise, or that rankings will improve.
- The W3C Event Timing document is a draft, and detailed target, LoAF, and script attribution are not uniformly available across browsers.
- The hypothetical worked example demonstrates a diagnosis. Its volumes, route values, phase split, and internal success rules are not industry benchmarks.
Independent HCI research reinforces one boundary: latency tolerance depends on task and context. A controlled CHIIR study of mobile web search found a gradual relationship between induced seconds-long delays and subjective ratings, with pronounced deterioration only at much larger delays in that specific task.9 It measured search response delay, not INP, and cannot replace the Web Vitals threshold. It does warn against turning any universal number into a complete model of perceived quality.
Google likewise states that good Core Web Vitals do not guarantee good rankings.10 Performance is a user-experience input and an engineering quality constraint, not a deterministic traffic lever. Measure task success, errors, abandonment, accessibility, and business outcomes beside INP, and use an experiment when you need a causal claim.
The decision after two years
The mature response to INP is not to replace one dashboard obsession with another. Preserve the distinction between population evidence and mechanism. CrUX answers whether eligible real Chrome visits have a distribution problem. Owned RUM identifies the route, target, phase, and context. A scripted lab interaction reproduces it. Lighthouse and DevTools prevent regressions and explain code. Business and accessibility metrics decide whether the product outcome improved.
Begin with the secondary routes that your homepage audit ignores. Segment before averaging. Record the denominator. Treat missing data as missing. Fix the dominant phase rather than “JavaScript” in the abstract. Keep TBT, but stop asking it to report a human interaction it never observed. The result is a smaller, testable engineering decision: this control, on this route, for this device population, improved after this release—and the evidence is strong enough to keep the change.
Sources
- Jeremy Wagner and Barry Pollard, web.dev, “Interaction to Next Paint (INP)”, published May 6, 2022; updated September 2, 2025. First-party Chrome metric documentation.
- W3C Web Performance Working Group, “Event Timing API”, Working Draft reviewed September 8, 2026. Work-in-progress web standard.
- Jeremy Wagner, web.dev, “Find slow interactions in the field”, reviewed September 8, 2026; and GoogleChrome,
web-vitalsv5 documentation and source. First-party implementation guidance and open-source library. - Jeremy Wagner and Barry Pollard, web.dev, “Optimize Interaction to Next Paint”, reviewed September 8, 2026. First-party optimization guidance.
- Himanshu Jariyal, Prathamesh Rasam, Humaira, Aaron T. Grogg, Barry Pollard, Stoyan Stefanov, and Tanner Hodges, “Performance,” 2025 Web Almanac, published January 15, 2026; updated May 5, 2026, figures 7.13–7.16. Independent community observational analysis using HTTP Archive and CrUX.
- Chrome UX Report, “CrUX API”, reviewed September 8, 2026. First-party API documentation.
- Chrome UX Report, “CrUX methodology”, reviewed September 8, 2026; and HTTP Archive, “2025 Web Almanac methodology”. First-party dataset documentation and independent community methodology.
- Philip Walton, web.dev, “Why lab and field data can be different (and what to do about it)”, reviewed September 8, 2026. First-party Chrome measurement guidance.
- Ioannis Arapakis, Souneil Park, and Martin Pielot, “Impact of Response Latency on User Behaviour in Mobile Web Search”, CHIIR ’21, 2021. Peer-reviewed controlled user study.
- Martin Splitt, Google Search Central, “Introducing INP to Core Web Vitals”, May 10, 2023; updated March 12, 2024. First-party search guidance.
- Jeremy Wagner and Rick Viscomi, web.dev, “Interaction to Next Paint becomes a Core Web Vital on March 12”, January 31, 2024. First-party program announcement.
- Philip Walton, web.dev, “Debug performance in the field”, reviewed September 8, 2026. First-party field-diagnostics guidance.