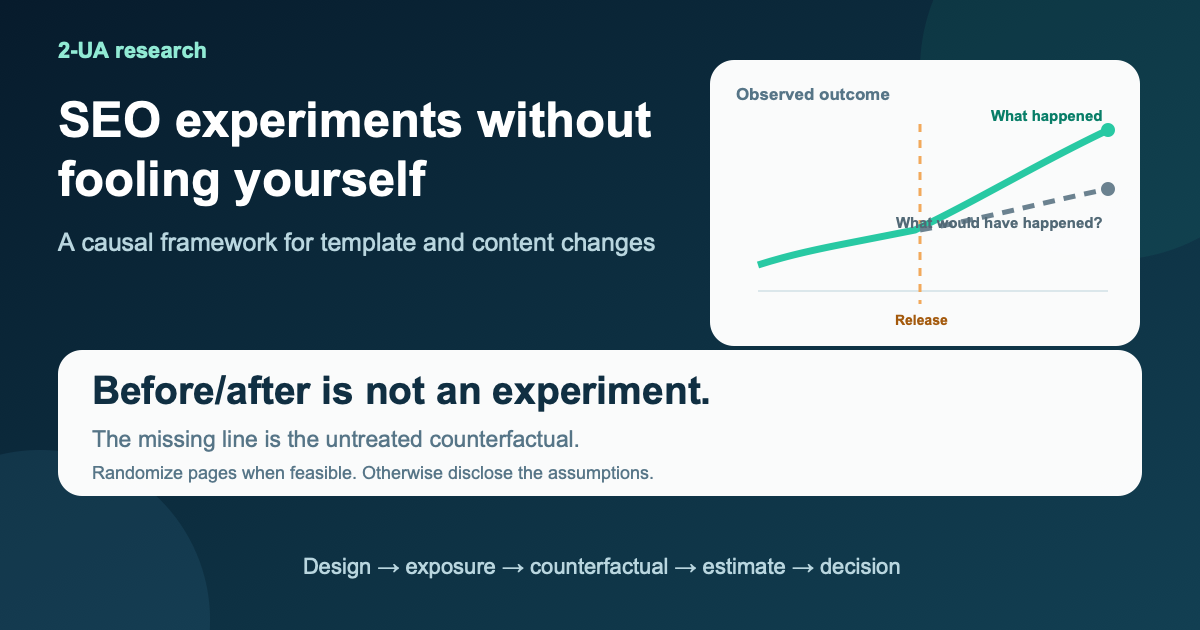
A marketplace changes title templates on 12,000 category pages. Four weeks later, clicks are up 18%. The launch deck calls the change a successful SEO experiment and proposes rolling the template across every locale. There is only one problem: an untreated category cohort rose 15% over the same weeks. Demand increased, a competitor ran out of stock, and Google changed the search-result layout. The attractive before/after chart did not estimate the template effect. It bundled the treatment with everything else that changed after launch.
That mistake is expensive in both directions. A false win scales a neutral or harmful template. A false loss kills a useful change because a demand drop hid its effect. An inconclusive result gets promoted to “no impact” even though the test could not detect the smallest effect the business cared about. The remedy is not a more ornate dashboard. It is a credible counterfactual: an estimate of the outcome the treated pages would have produced during the same period had they remained untreated.
This guide turns that requirement into a practical design selector for template and content changes. It distinguishes randomized page-cohort tests, matched controls, interrupted time series, and descriptive before/after monitoring; explains where each can fail; and provides a pre-analysis contract, a worked example, stop rules, and a 30-day measurement plan. The goal is not to make every SEO release causal. It is to know which claims the design can support before the result tempts the team to say more.
The missing object is the counterfactual
A causal question compares two potential outcomes for the same unit at the same time: what happened under treatment and what would have happened without treatment. Only one can be observed. The second must be recovered by design. Random assignment makes treatment and control comparable in expectation. A matched-control or time-series model tries to reconstruct comparability from observed history and therefore needs stronger assumptions.
In SEO, the unit is often a canonical URL, a page cluster, or a template-defined group rather than a person. The treatment might be a title pattern, body-copy module, internal-link block, structured-data field, or rendering change. The outcome might be clicks per eligible URL, impressions, indexed coverage in a fixed sample, non-brand query clicks, or a qualified user action. Each choice changes what is randomized, what can interfere, and what the estimate means.
“Traffic rose after release” is an observation. “The release caused traffic to rise” is a comparison with an unobserved state. Calendar effects, query demand, competitor availability, sitewide releases, crawling and indexing delays, SERP features, measurement changes, and unrelated algorithmic changes can all move the observed series. A design earns causal language only by blocking or modeling plausible alternative paths.
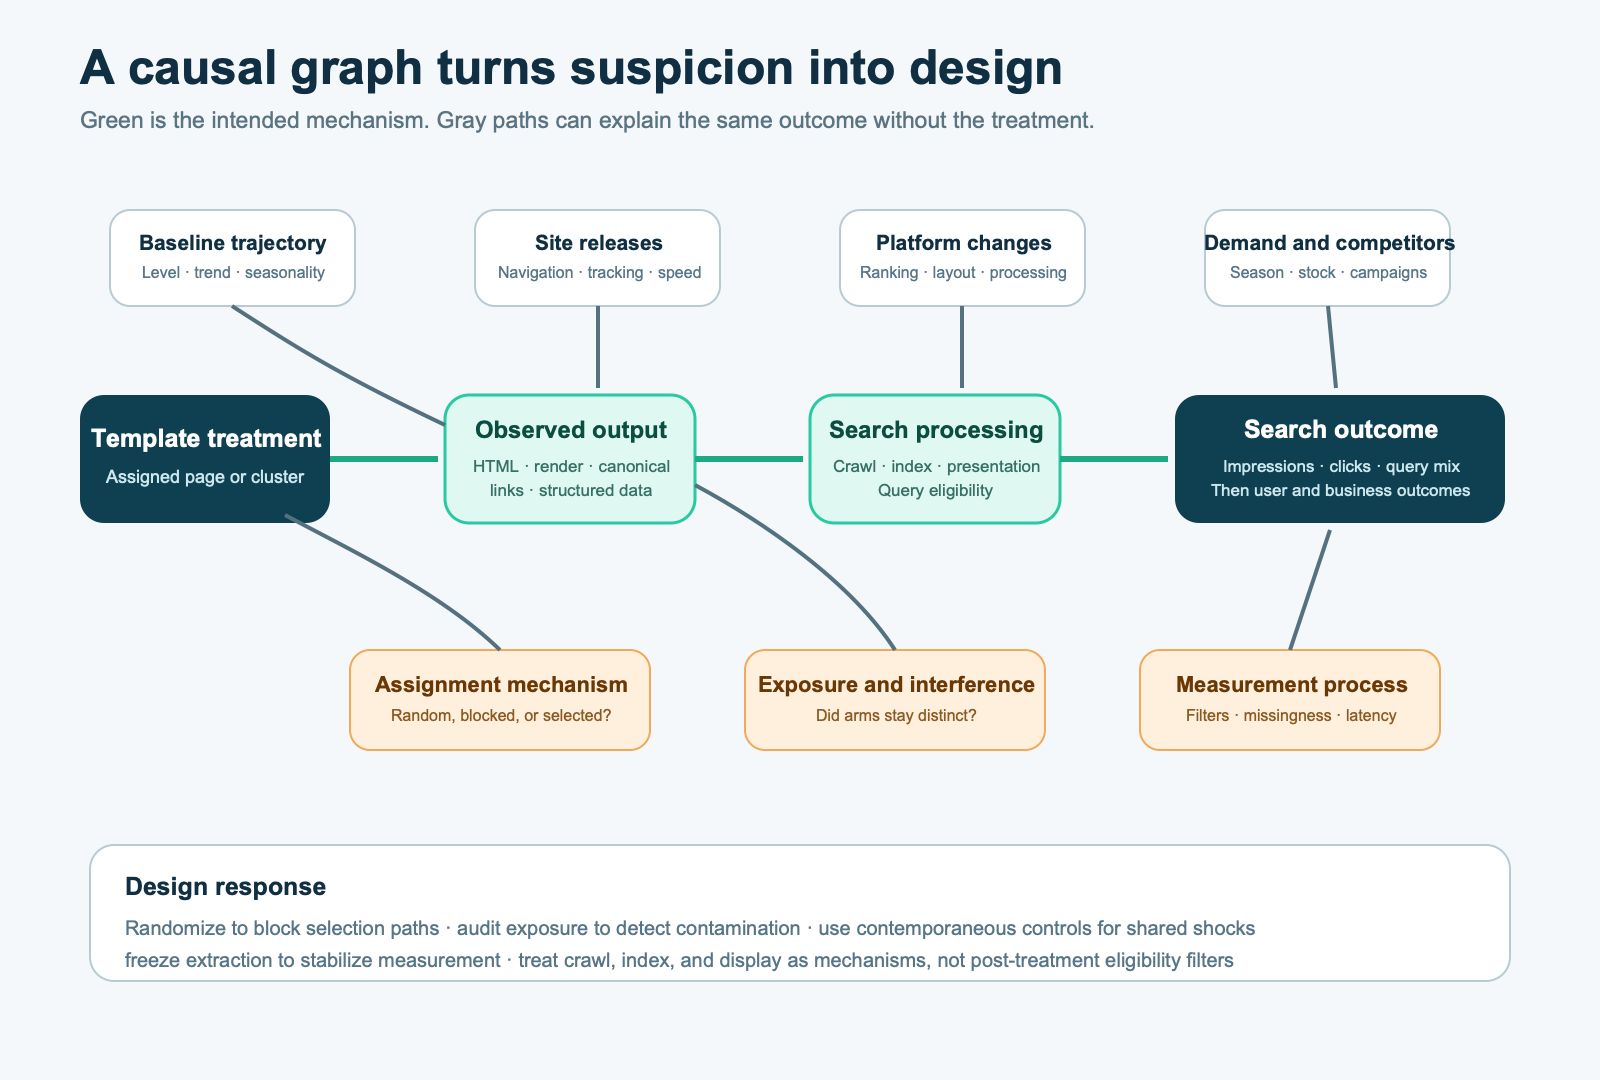
Four designs, four different claims
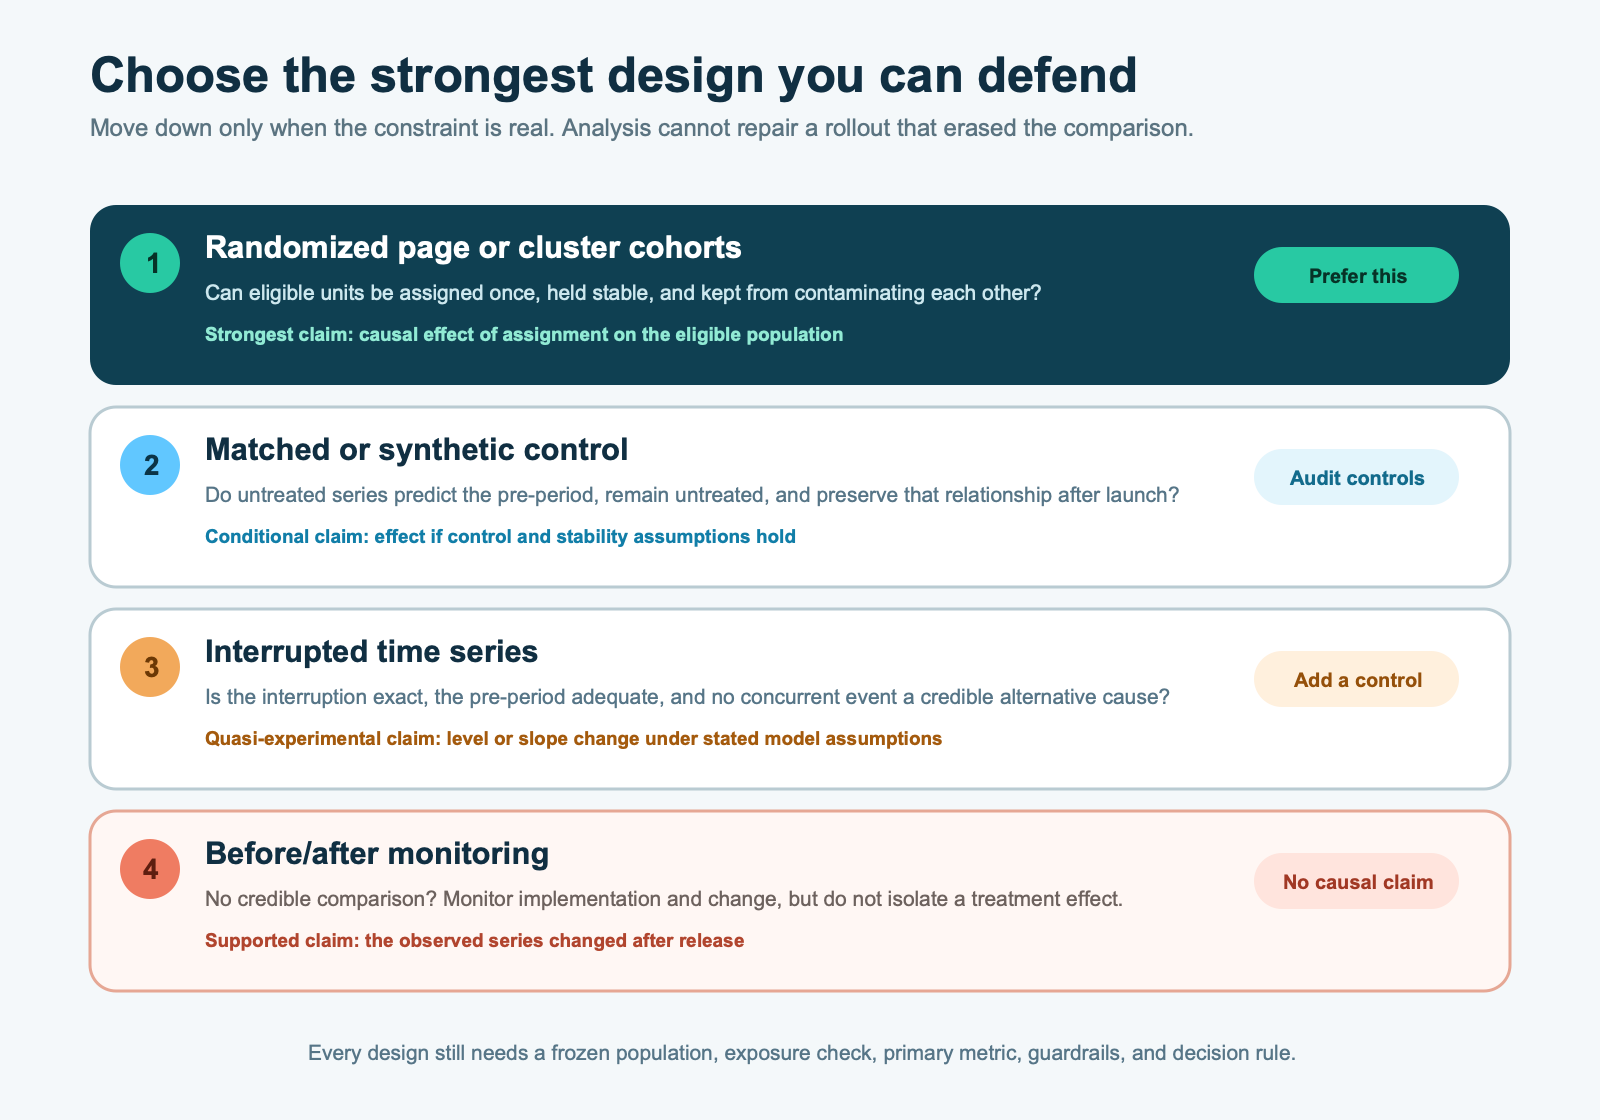
The design should be selected before the implementation plan, not after the data arrives. Begin with the strongest feasible comparison and move down only when the operational constraint is real. More sophisticated analysis cannot recover information that the rollout destroyed.
1. Randomized page cohorts
Randomly assign eligible URLs to treatment and control, keep assignment stable, release the change only to treatment pages, and compare outcomes over the same calendar period. This is the strongest practical design for many repeatable templates because randomization distributes observed and unobserved baseline differences across the groups in expectation. The estimand is the effect of assigning the eligible page population to the change, not the effect on all pages or all future queries.
Randomization does not excuse poor construction. The page must be the analysis unit if the page is the assignment unit. A site with 20,000 URLs but six independently managed category families may have closer to six useful clusters, not 20,000 independent observations. Pages can share navigation, canonicals, inventory, queries, and ranking results. If the treatment on one URL changes links or duplicate relationships for control URLs, interference breaks the simple independent-unit story.
Stratify before randomizing when baseline scale or page type strongly predicts the outcome. Pair or block pages by locale, template, historical impressions, seasonality, indexability, and commercial role, then randomize within those blocks. Freeze eligibility before assignment. Removing weak treatment pages after seeing results changes the population and can manufacture a win.
2. Staggered randomized rollout
When the business intends to ship broadly but can sequence the release, randomly choose which eligible clusters receive the change first. Later waves serve as contemporaneous controls during the first window. This can be easier to approve than a permanent holdout and still preserves random assignment. The analysis must stop or change when the control wave receives treatment; it is no longer untreated after crossover.
Staggering also helps separate implementation latency from search latency. The release log proves when the HTML changed. A fixed crawl checks whether the intended output is present. Search evidence may arrive later. Do not reset the experiment clock to the first favorable movement: the launch and analysis windows were part of the design.
3. Matched control or synthetic control
If randomization is unavailable, select untreated pages or series that predicted the treated outcome before launch. Matching may use template, market, demand pattern, historical level and trend, age, and index state. A synthetic control combines several unaffected predictors to forecast the treated series after intervention. The estimated effect is the gap between the observed treatment series and that forecast.
The method is credible only while the controls remain untreated and the pre-period relationship remains useful after launch. The peer-reviewed CausalImpact paper makes that boundary central: contemporaneous controls must not receive the intervention, and the relationship used to predict the counterfactual must remain sufficiently stable. A sitewide navigation change, shared promotion, migrated analytics tag, or search change that affects treatment and candidate controls differently can invalidate the model while leaving a polished posterior chart.
Choose controls from business logic, not only from whichever series maximizes pre-period fit. Preserve a control-exposure audit: shared templates, internal links, canonicals, product inventory, promotions, locales, devices, and query families. Run placebo interventions in the pre-period and on untreated cohorts. Poor placebo behavior is evidence against the design, not a parameter-tuning invitation.
4. Interrupted time series
An interrupted time series models the outcome repeatedly before and after a clearly dated intervention, allowing a level change, a slope change, or both. It is stronger than comparing two period totals because it estimates the existing trend and can model seasonality and autocorrelation. Adding a contemporaneous control series makes the design more defensible.
It remains quasi-experimental. Another event at the interruption can produce the same level or slope change. Cochrane's methods guidance requires a clearly defined interruption and multiple observations on both sides, and recommends regression that adjusts for time trends, autocorrelation, and periodic changes or an appropriate ARIMA analysis. Its minimal three-before/three-after inclusion rule is not a claim that six points provide adequate power for noisy SEO data. Daily search data often needs a substantially longer pre-period to learn weekday, seasonal, and volatility patterns.
5. Before/after monitoring
Sometimes every eligible page must change at once and no reliable control exists. Record the release, inspect implementation, and plot the series. Call it monitoring or a before/after analysis. It can detect a regression, describe timing, and trigger investigation. It cannot by itself separate the release from everything else that crossed the same date. Honest descriptive evidence is more useful than causal decoration.
Define the unit before counting the sample
The label “10,000-page test” sounds powerful, but page count is not automatically sample size. If all pages share one template switch and one demand shock, their outcomes are correlated. Treating every daily URL row as independent produces confidence intervals that are too narrow. Name the assignment unit, analysis unit, and randomization cluster explicitly.
- URL-level assignment: appropriate when one URL's treatment does not materially alter another URL's exposure and canonical identity.
- Cluster assignment: appropriate for category families, locales, or templates with shared navigation, demand, or inventory.
- Query-level assignment: rarely controlled by a site owner; query overlap across URLs can create interference and cannibalization.
- User-level assignment: strong for on-site behavior tests, but not equivalent to testing what a crawler indexes or ranks.
- Time-level assignment: switchback designs alternate treatment over time, but search carryover makes clean reversal difficult.
Avoid cookie-based user A/B logic as a substitute for a page-cohort SEO test. Google notes that Googlebot generally does not support cookies, so it may see only the no-cookie experience. User randomization can answer a conversion question while exposing one stable version to search engines; it does not estimate the search effect of two page variants.
Write the estimand in one sentence
A good experiment begins with the quantity the team wants to learn. For example: “Among canonical English category pages eligible on September 15, what is the 28-day average effect of assigning the new evidence-led title template on finalized Google Search clicks per URL, compared with retaining the old title template?” That sentence fixes the population, treatment, comparison, horizon, outcome, aggregation, and assignment interpretation.
It also exposes disagreements early. If product wants revenue, editorial wants impressions, and engineering wants crawl stability, clicks cannot quietly become the sole definition of success. Choose one primary decision metric, define guardrails, and retain diagnostic metrics to explain the path. A metric should not be promoted from diagnostic to primary because it happens to turn green.
| Metric role | Example | Decision use | Failure to avoid |
|---|---|---|---|
| Primary | Finalized non-brand clicks per eligible URL over 28 days | Determines ship, reject, or remain inconclusive | Switching to impressions after clicks miss |
| Guardrail | Indexable canonical rate, error rate, conversion per landing session | Blocks a rollout that harms system or user value | Calling a traffic win sufficient despite damage |
| Diagnostic | Crawl state, title rewrite pattern, CTR numerator and denominator | Explains mechanism and data quality | Mining diagnostics until one is significant |
| Decision threshold | Smallest lift worth maintenance and rollout cost | Separates statistical detection from business value | Shipping any non-zero estimate |
Pre-analysis is where most false wins are prevented
The analysis contract should be timestamped before assignment is revealed or post-launch outcomes are examined. It need not be academic registration. A versioned document, ticket, or immutable experiment record is enough if it contains the choices that would otherwise be movable after the result.
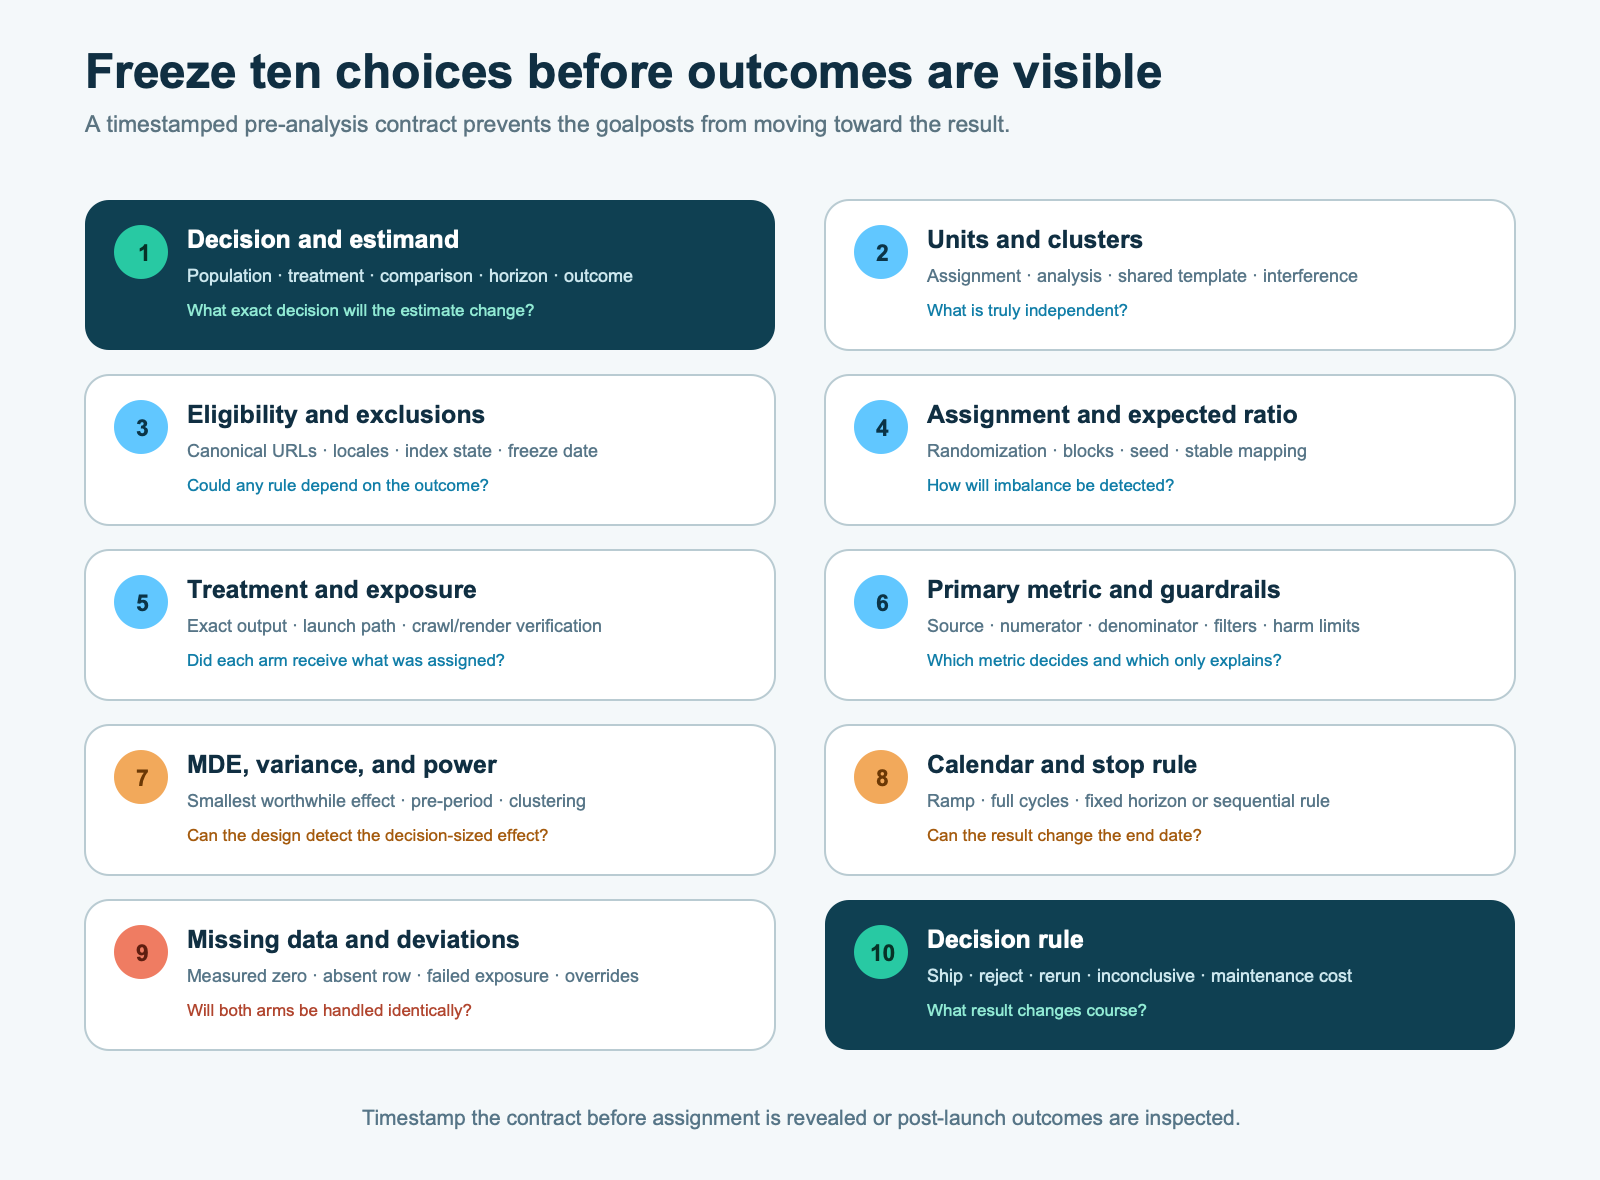
- Decision and hypothesis: name the product decision, causal mechanism, and expected direction.
- Population and eligibility: freeze canonical URLs, locales, templates, index state, and exclusions.
- Assignment and analysis units: record randomization method, clusters, strata, and expected treatment ratio.
- Treatment: preserve exact before and after output, release mechanism, exposure check, and rollback.
- Primary outcome: define source, numerator, denominator, aggregation, filters, and finalized-data rule.
- Guardrails and diagnostics: set harm thresholds and mechanism checks without turning all metrics into success tests.
- Minimum detectable effect and power: use baseline variance and unit count to determine whether the decision is learnable.
- Calendar and stop rule: fix launch, ramp, minimum duration, analysis date, and valid sequential method if monitoring continuously.
- Missing data and exclusions: state handling before learning which arm loses rows.
- Decision rule: define ship, reject, rerun, and inconclusive outcomes, including maintenance cost and uncertainty.
Power starts with a business effect, not available pages
Choose the smallest effect that would change the rollout decision. Estimate outcome variance and correlation from a clean pre-period or an A/A split. Then calculate the number of independent units and duration needed for the selected design. A statistically detectable 0.2% lift can still be smaller than implementation and maintenance cost; a commercially important 5% lift can remain undetectable on a small cohort.
The Microsoft metric-pitfalls study includes an instructive case: an observed 0.5% movement was not statistically significant, but the experiment could detect only changes of 7.8% or larger with 80% power under its configuration. The correct conclusion was not “no effect.” It was that the metric was underpowered for the business-sized change. The numbers belong to that Microsoft experiment, not an SEO benchmark, but the interpretation transfers.
Report the effect estimate with an interval and compare the whole plausible range with the decision threshold. If the interval contains meaningful harm and meaningful benefit, the result is inconclusive. More decimal places do not resolve missing information.
Stop rules are part of the statistical method
Checking a conventional fixed-horizon p-value every day and stopping on the first favorable result inflates false positives. Continuing a planned two-week test for a third week only because the primary metric almost reached significance is the same problem in reverse. The data influenced the sample size while the analysis pretended sample size was fixed.
Use one of two honest approaches. For a fixed-horizon design, choose the analysis date in advance and treat interim dashboards as operational monitoring; stop early only for a predeclared severe guardrail breach. For continuous decision-making, use a valid sequential method with its boundaries and decision rules specified before launch. The peer-reviewed always-valid inference paper exists precisely because ordinary p-values and confidence intervals are not valid under arbitrary continuous peeking.
A calendar rule still needs domain sense. Search outcomes have weekday patterns and delayed crawling, indexing, and serving. The older Microsoft web- experimentation survey recommends full-week multiples to address day-of-week effects in user experiments. That is a useful floor, not proof that one or two weeks is sufficient for SEO. Duration comes from power, expected exposure latency, and a stable comparison, not a generic 14-day recipe.
Validate assignment and exposure before reading the effect
A sample-ratio mismatch occurs when observed allocation differs unexpectedly from the configured allocation. The 2019 KDD study built a taxonomy from more than 10,000 online controlled experiments across four companies, supported by internal records and 14 practitioner interviews. It identified causes across assignment, execution, logging, analysis, and interference. Its context is large-scale software experimentation, so the prevalence does not transfer to SEO. The operating lesson does: investigate an unexpected ratio before trusting the outcome.
For a page-cohort test, compare the assigned URL counts and the observed eligible URL counts. Then verify exposure from fetched HTML or rendered output. A 50/50 assignment can become 46/54 after canonical exclusions, failed deployments, missing GSC rows, or a post-treatment filter. Do not drop pages because they received no impressions after treatment; zero outcome can be part of the treatment effect. Separate true missing measurement from measured zero.
Run an A/A test when the pipeline is new: assign pages to two labels while serving identical output, then execute the complete extraction and analysis. Repeated false differences reveal broken independence assumptions, unstable joins, or variance estimates before a real decision depends on them.
Search metrics need denominator discipline
Search Console clicks, impressions, CTR, and average position answer different questions. CTR is clicks divided by impressions, so a treatment can change both numerator and denominator. A new title can earn exposure on a broader query mix, raise clicks, and lower CTR. Reporting only the rate can call that outcome a loss. Always preserve clicks and impressions beside CTR, plus the unit-level distribution rather than only a pooled total.
Google documents that Search Console data is aggregated and privacy-filtered. Anonymized queries can contribute to chart totals while being absent from query rows, and the Search Analytics API does not guarantee every row. Recent data can be incomplete. Freeze extraction method, property, search type, aggregation, dimensions, country, device, date timezone, query filter, and finalized-data rule. A treatment and control extracted with different filters are not comparable just because both came from Search Console.
Average position is especially easy to misuse. It is an impression-weighted average across changing queries, pages, devices, countries, and search appearances. A shift can reflect a new exposure mix rather than movement for a stable query-URL pair. Use it diagnostically with impression and query-mix evidence; do not let one aggregate position number become the sole primary outcome.
Search-safe implementation is separate from causal validity
A statistically elegant experiment can still create a search implementation problem. Google's current website-testing guidance says not to cloak test pages, notes that Googlebot generally does not support cookies, recommends a canonical to the original when multiple temporary variant URLs are used, recommends temporary rather than permanent redirects for redirect tests, and says to remove experiment artifacts after the test. These are search-handling safeguards, not evidence that the test design is causal.
For template SEO tests, a stable page-cohort design often avoids alternate variant URLs entirely: each canonical URL remains itself, while eligible URLs are deterministically assigned to old or new template output. Humans and crawlers receive the same output for a URL. Preserve assignment across deploys and caches. Confirm self-canonicals, status codes, robots directives, hreflang, structured data, navigation, and rendered content in both arms.
Content tests need an editorial boundary. Do not generate low-value treatment pages or near-duplicates merely to increase sample size. The comparison should test a coherent content policy applied to eligible pages, not create search-engine-only variations. If a change cannot be served consistently to users and crawlers, it is not an acceptable treatment.
Worked example: the 18% win that shrank to 3 points
Consider a hypothetical catalog with 2,400 eligible English category pages. The team blocks by category family and baseline finalized clicks, then randomizes 1,200 pages to an evidence-led title template and 1,200 to the existing template. The primary outcome is a normalized weekly click index per assigned URL; 100 equals each arm's pre-period mean. The treatment is the only planned template difference. Canonical rate, indexability, page speed, and conversion per landing session are guardrails.
After four weeks, the treatment index is 118. A before/after deck reports +18%. Control is 115. The simplest change-from-baseline contrast is therefore +3 index points, not +18%. That three-point estimate still needs an uncertainty interval based on the randomized clusters, an assignment and exposure audit, and guardrail review. In this teaching example, assume the interval crosses zero. The correct decision is inconclusive: the data do not separate a worthwhile lift from no effect with enough precision.
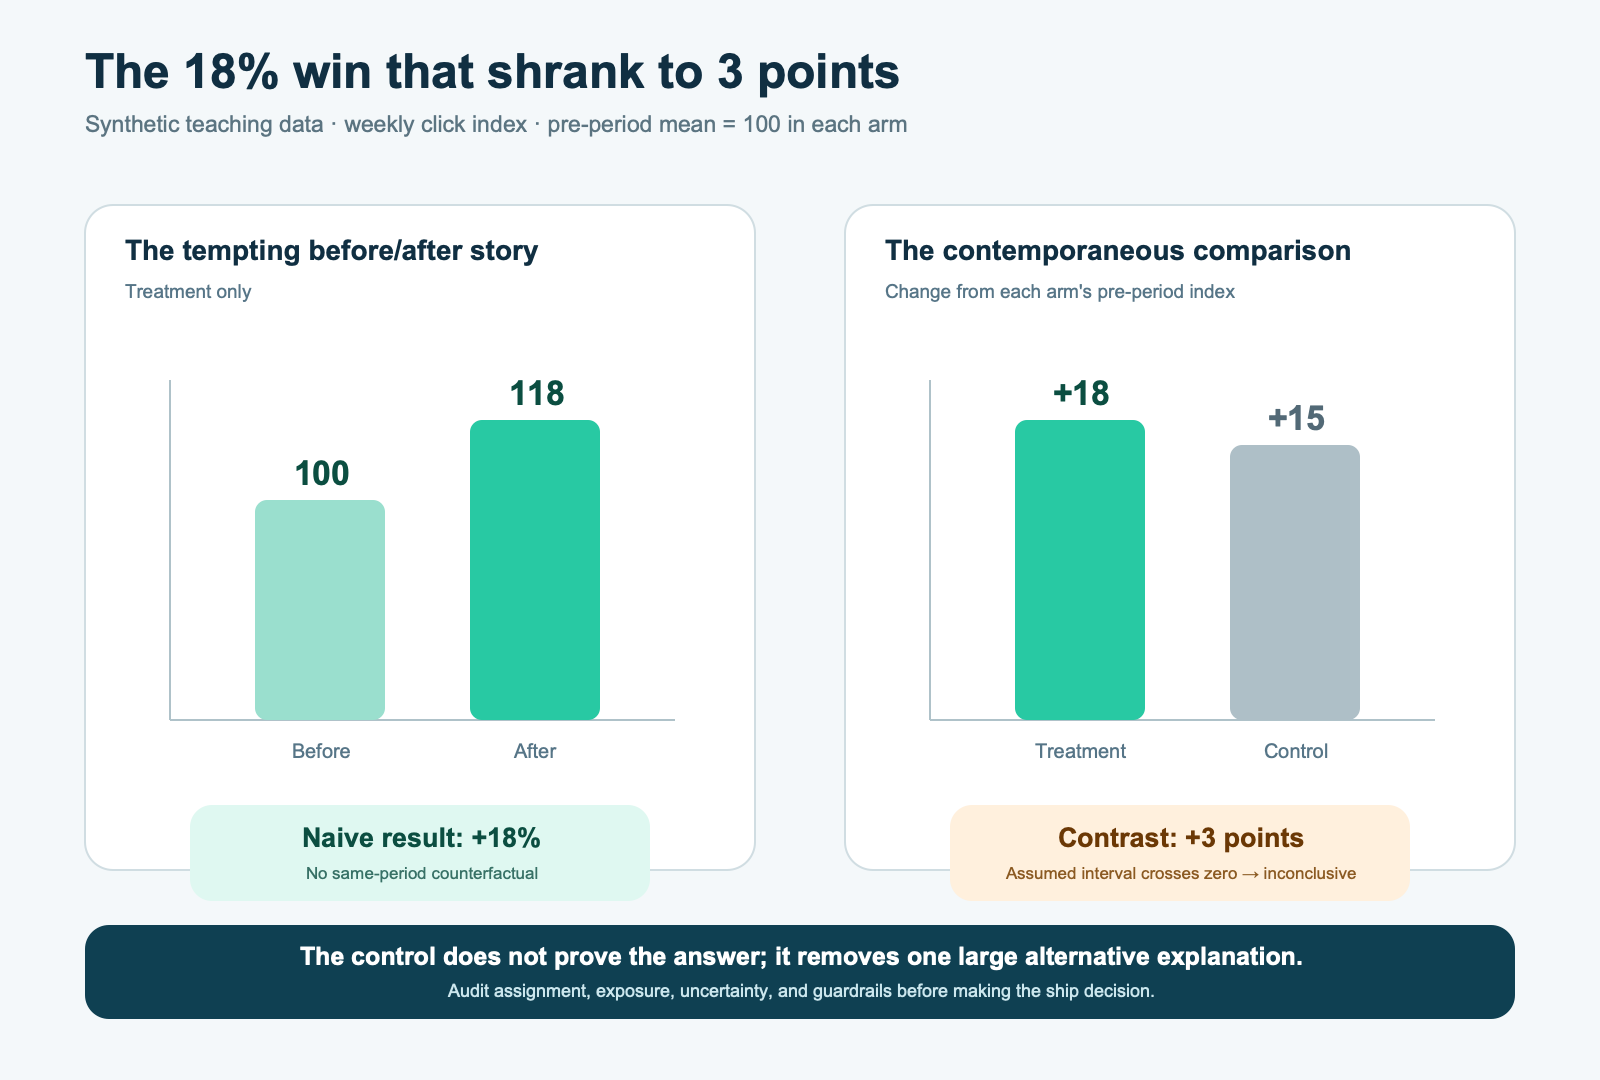
The postmortem asks what generated the other 15 points. Both arms experienced the same seasonal demand and competitor stock event. Search Console's finalized-data schedule was identical. The exposure audit found the intended titles on 99.5% of treatment pages and old titles on 99.6% of controls; failures were retained by assigned arm. No guardrail crossed its threshold. The result did not fail operationally. It failed to reach the precision needed for a ship claim.
The team can keep the existing template, run longer if the predeclared sequential or extension rule allows it, or design a new adequately powered test. It cannot call the +18% causal, declare the +3 points positive because its sign is above zero, or search countries and devices until one subgroup wins.
The causal graph is a release checklist
Draw the expected mechanism before launch. A title treatment may change the text Google processes, which may change the displayed title and query-level presentation, which may change impressions and clicks. It should not directly change server errors or canonical identity. Those become guardrails. A body- content treatment may change internal linking, rendered bytes, relevance, engagement, and conversion, so the graph is wider.
Add common causes of treatment assignment and outcome. If editors choose the pages that “need help,” baseline decline causes treatment selection and later performance. If the growth team chooses high-potential categories, expected demand causes both treatment and outcome. Randomization blocks those paths. Matching attempts to measure and balance them. Neither fixes an unmeasured rule that still determined selection.
Add post-treatment variables last. Indexing, impressions, and rendered title are mechanisms, not safe filters. Conditioning the primary analysis on pages that were indexed, received impressions, or displayed the new title can select a population partly created by the treatment. Analyze assigned units first; use mechanism subsets as clearly labeled diagnostics.
What the evidence does not show
The evidence does not provide a universal SEO-test duration, minimum page count, minimum detectable lift, or acceptable confidence threshold. Those depend on the decision, baseline variance, correlation, assignment unit, measurement delay, and cost of error. Recommendations from high-traffic user experiments cannot be copied as sample-size rules for page-level search outcomes.
It does not show that CausalImpact, synthetic control, difference-in-differences, or an interrupted time-series package automatically creates causality. Each estimates a counterfactual under assumptions. Unaffected controls, stable relationships, correct functional form, adequate pre-period fit, no concurrent intervention, and honest model selection remain substantive requirements.
It does not show that Search Console contains every query row, that an absent row means zero activity, that average position is a fixed rank, or that a four-week window captures a durable search effect. Google's documentation explicitly describes aggregation, filtering, top-row limits, and incomplete recent data. Those properties belong in the measurement contract.
It does not show that a statistically significant search effect improves profit, user satisfaction, or long-term brand demand. Nor does a non-significant result prove equivalence or zero harm. Business value requires a threshold and guardrails; equivalence or non-inferiority requires a design built for that claim.
Finally, the evidence does not show that every SEO change should be held back for an experiment. Accessibility fixes, broken canonicals, security repairs, legal requirements, and obvious rendering defects may have an action threshold independent of traffic lift. Measure them, but do not withhold correctness merely to create a control group.
The strongest counterposition: search is too unstable for causal tests
The strongest objection is that a site does not control Google, query demand, competitors, crawling, or the SERP. Page outcomes interfere, assignment units are correlated, exposure is delayed, and Search Console is aggregated. A classical experiment can therefore look cleaner on paper than the system it is supposed to measure.
The objection defeats weak designs, not the entire project. Randomization does not require controlling every external event; it requires those events to affect treatment and control comparably in expectation. Blocking by page family and analyzing at the assignment-cluster level can respect shared shocks. Exposure checks, guardrails, and contemporaneous controls make failures visible. When interference is too broad or the independent unit count is too small, the honest outcome is that the proposed causal question is not identifiable with this rollout.
That boundary is valuable. It stops a team from spending statistical language on an answer the implementation cannot produce. The release can still be monitored descriptively, reversed on harm, and used to form a better hypothesis. The causal framework does not guarantee an experiment; it prevents a release chart from impersonating one.
Small sites and large platforms need different ambitions
A small site with 80 heterogeneous pages may not have enough independent units for a page-cohort traffic test. Use qualitative content review, technical acceptance checks, user testing, and descriptive monitoring. If several similar pages exist, a staggered rollout or carefully matched case series may be informative, but wide intervals and strong assumptions should remain visible. Do not manufacture sample size by treating daily observations as independent.
A large platform can randomize thousands of pages yet still fail through contamination. Template components create shared internal links; inventory moves across related categories; hreflang and canonicals join URLs; editors override assignments; and multiple experiments collide. Use cluster randomization, an experiment registry, mutual-exclusion layers where necessary, automated exposure checks, sample-ratio tests, and analysis based on the randomized unit.
For both scales, operational quality precedes effect estimation. If treatment output is missing, control pages changed, tracking broke, or canonical states diverged unexpectedly, stop and diagnose. A larger dataset makes a broken design confidently wrong.
Implementation checklist
- State the decision and one-sentence estimand before choosing the rollout.
- Freeze the eligible canonical URL population and record every exclusion reason.
- Map shared templates, links, inventory, locales, canonicals, and queries to choose the assignment cluster.
- Prefer randomized page or cluster assignment; stratify on major baseline predictors.
- If randomization is impossible, document why and select controls before viewing post-launch outcomes.
- Capture enough pre-period history to assess trend, seasonality, variance, correlation, and placebo behavior.
- Define the primary metric's source, numerator, denominator, unit, filters, aggregation, timezone, and finalized-data rule.
- Set a minimum effect worth shipping, power target, guardrail thresholds, and an inconclusive outcome.
- Predeclare the analysis date or a valid sequential method; do not stop when an ordinary p-value first turns favorable.
- Serve the same stable URL output to users and crawlers; avoid cloaking and temporary variant residue.
- Verify treatment exposure, canonical, robots, response, rendering, structured data, and navigation in both cohorts.
- Check assigned and observed cohort ratios before outcome analysis; investigate unexpected loss or filtering.
- Analyze by assigned unit first and keep post-treatment mechanism filters diagnostic.
- Report estimate, interval, denominator, missingness, guardrails, protocol deviations, and assumptions.
- Retain the assignment, snapshots, extracts, code, and decision so the result can be audited or reproduced.
A 30-day measurement plan
This week: design before deployment
- Select one coherent change and one eligible population; defer bundled title, copy, schema, and navigation changes.
- Write the estimand, causal graph, primary metric, minimum worthwhile effect, guardrails, and decision table.
- Run baseline crawl and rendering checks on desktop and mobile where output can differ.
- Export finalized Search Console history with a frozen extraction query; retain numerator and denominator fields.
- Estimate variance and clustering, choose the design, generate assignment, and lock the analysis record.
- Dry-run exposure and measurement with an A/A cohort if the pipeline has not been validated.
Days 1–7: validate execution, not rankings
- Ramp only as planned and use guardrails for operational aborts.
- Fetch a fixed sample from both arms and confirm exact template output, status, canonical, robots, hreflang, links, and rendering.
- Compare assigned, deployed, crawled, and measured unit counts; investigate any unexpected ratio.
- Annotate unrelated releases, promotions, outages, migrations, and platform events without changing controls post hoc.
- Keep effect dashboards masked or operational-only until the fixed analysis point unless a valid sequential design was chosen.
Days 8–30: read the causal chain in order
- Exposure: require the intended output to remain stable for assigned pages.
- Crawl and index: use repeatable crawls and a fixed external inspection sample; do not condition the main cohort on success.
- Search presentation: inspect query mix, impressions, title display, CTR numerator and denominator, and device/country balance.
- Primary outcome: wait for the predeclared finalized-data window, then estimate treatment-control difference with uncertainty.
- User and business guardrails: check landing quality, conversion, latency, and error outcomes from the appropriate analytics systems.
- Robustness: run predeclared sensitivity and placebo checks; label unplanned segments exploratory.
Change course when the design fails
Roll back for a predeclared severe technical or user guardrail breach. Repair and rerun when assignment, exposure, measurement, or cohort ratios fail. Reject the causal claim when controls were treated, the relationship broke, a concurrent change aligns with the interruption, or interference crosses arms. Ship only when the estimated benefit is precise enough to clear the business threshold and guardrails hold. Keep the current version when the result is inconclusive; “we did not learn enough” is a valid result.
Where 2-UA fits—and where it does not
2-UA can establish monitoring baselines, crawl assigned URL cohorts, verify status, canonical, robots, links, rendered content, and desktop/mobile output, and help document whether the intended treatment stayed live. Those checks support exposure and guardrail evidence. 2-UA is not a randomization service, causal estimator, Search Console experiment platform, server-log warehouse, RUM system, or conversion analytics tool. Assignment, statistical analysis, Google performance data, and business outcomes remain external responsibilities.
If you need a stable technical baseline around an independently designed test, start with a 2-UA crawl and monitoring record. Use it to verify what changed—not to claim why traffic moved.
Sources
- Google Search Central. Minimize A/B testing impact in Google Search. Updated December 10, 2025; accessed September 15, 2026.
- Google Search Console API. Search Analytics: query. Accessed September 15, 2026.
- Google Search Central. A deep dive into Search Console performance data filtering and limits. October 19, 2022; accessed September 15, 2026.
- Brodersen, Kay H., et al. Inferring causal impact using Bayesian structural time-series models. The Annals of Applied Statistics, 9(1), 247–274, 2015.
- Kohavi, Ronny, Roger Longbotham, Dan Sommerfield, and Randal M. Henne. Controlled experiments on the web: survey and practical guide. Data Mining and Knowledge Discovery, 18, 140–181, 2009.
- Kohavi, Ronny, et al. Online experimentation at Microsoft. Microsoft Research, July 2009.
- Dmitriev, Pavel, Somit Gupta, Dong Woo Kim, and Garnet Vaz. A Dirty Dozen: Twelve Common Metric Interpretation Pitfalls in Online Controlled Experiments. KDD, 2017.
- Fabijan, Aleksander, et al. Diagnosing Sample Ratio Mismatch in Online Controlled Experiments: A Taxonomy and Rules of Thumb for Practitioners. KDD, 2019.
- Johari, Ramesh, Pete Koomen, Leonid Pekelis, and David Walsh. Always Valid Inference: Continuous Monitoring of A/B Tests. Operations Research, 70(3), 1806–1821, 2022.
- Cochrane Effective Practice and Organisation of Care. Analysis in EPOC reviews. 2017 methods resource; accessed September 15, 2026.