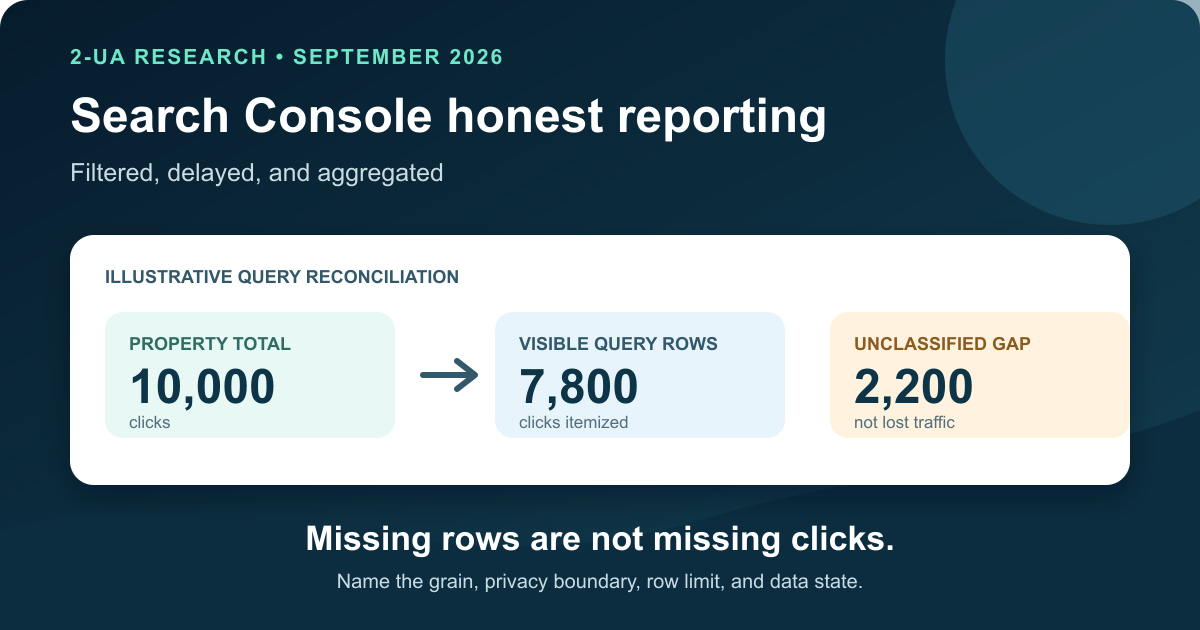
Search Console is not a raw event ledger. It is a reporting system built from Google Search observations after counting rules, canonical assignment, aggregation, privacy protection, row selection, and freshness rules have been applied. That does not make the data untrustworthy. It makes the data conditional. A trustworthy report names those conditions before it turns a number into a business conclusion.
The practical job is to preserve three distinctions. A total is not always the sum of visible rows. A Search Console click is not an Analytics session. An average position is not the rank of a fixed keyword. Once those boundaries are explicit, Search Console becomes excellent evidence for trends, segments, and diagnostic questions. When they are hidden, a polished dashboard can manufacture certainty.
This guide provides a reporting contract, an extraction-path decision, a worked average-position failure, a reconciliation method, and a 30-day control plan. It is based on current first-party product documentation read on September 29, 2026, plus independent data-publication standards. It does not infer undocumented coverage rates or pretend that an unavailable query can be reconstructed.
The answer in one minute
- Treat the unfiltered property total as a total, not a promise that every click has a visible query row. Anonymized queries can contribute to chart totals while their query text is withheld. Query filters remove that anonymized contribution.
- Record the grain. Property aggregation and page aggregation count impressions, clicks, and position differently when several URLs from one property appear in the same result set.
- Freeze decision windows. Recent data may be preliminary and change within hours. Use it for incident awareness; use complete, stable windows for client, board, and experiment decisions.
- Choose an extraction path by scale and question. The interface is for exploration, the Search Analytics API is for repeatable bounded retrieval, and bulk export is for ongoing high-volume analysis. None reveals anonymized query text.
- Recalculate ratios from additive components. Sum clicks and impressions, then calculate CTR. For position, use impression-weighted position data at a consistent grain; never average displayed averages.
- Segment before explaining. A blended average can move because the query, page, device, country, or search-appearance mix changed even when a strategically important segment improved.
- Do not force clicks to equal sessions. Search Console measures interaction in Google Search; Analytics measures activity after the site loads under a different timezone, consent, attribution, canonical, and implementation model.
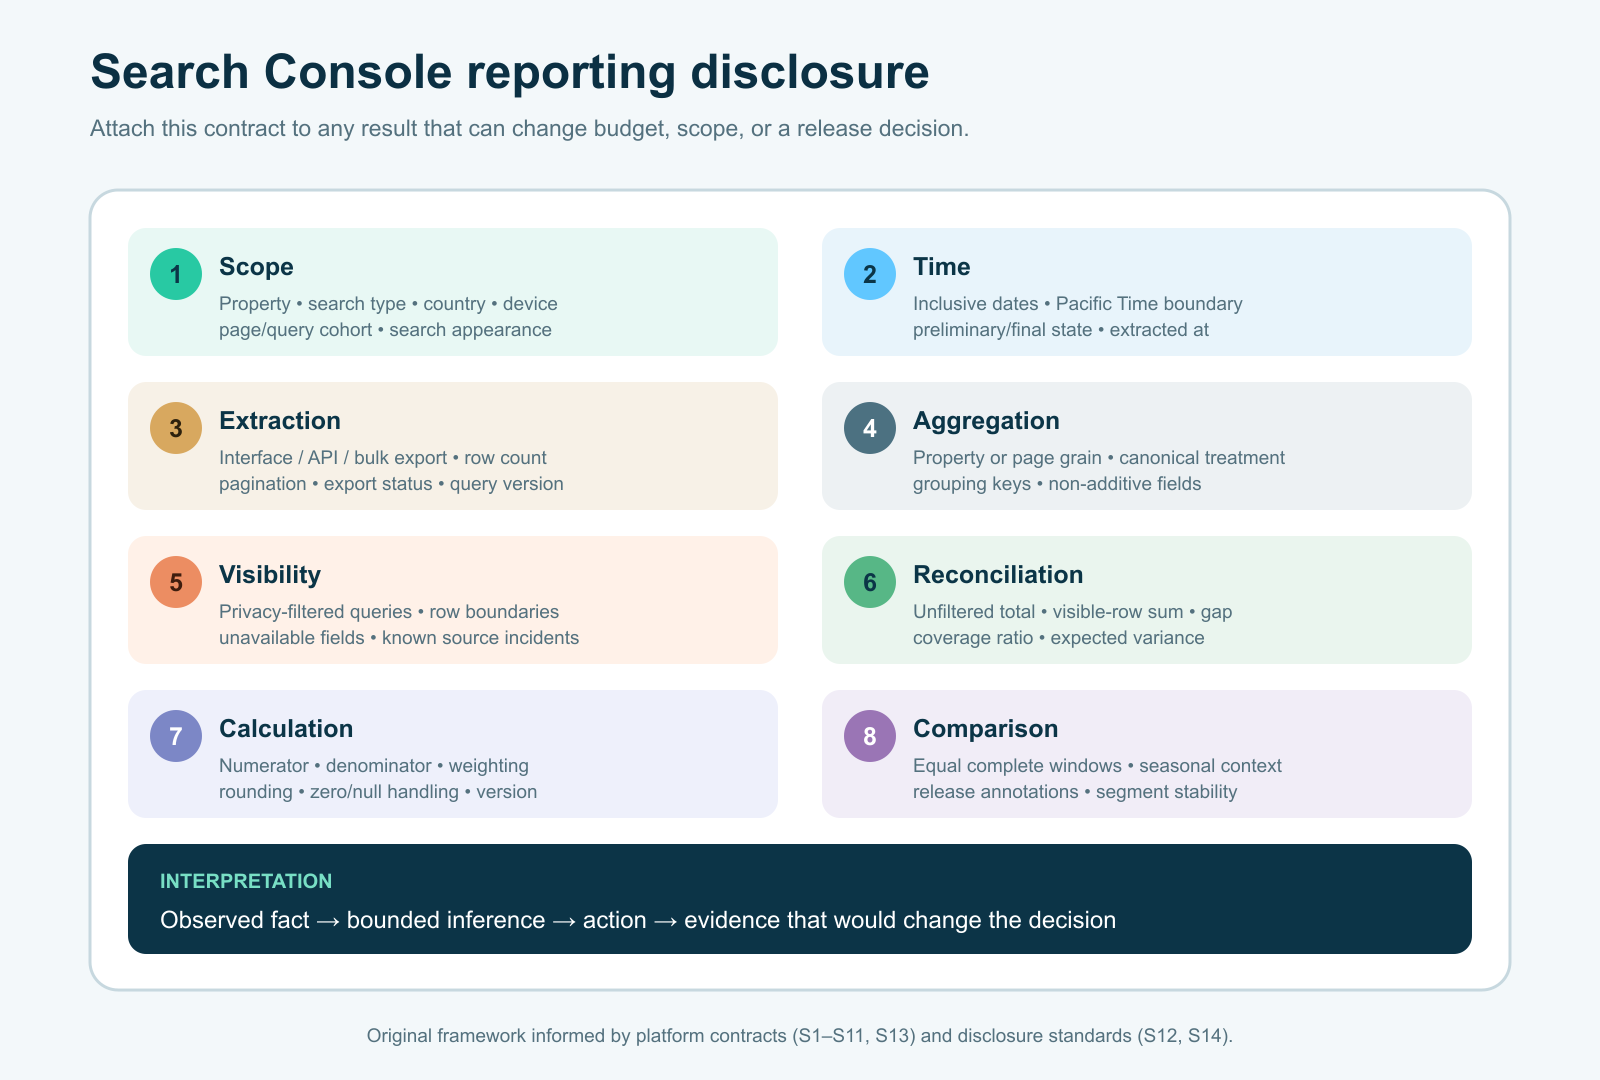
- Publish a disclosure block. State property, search type, timezone, dates, freshness, extraction path, dimensions, filters, aggregation, row limits, privacy exclusions, and known incidents beside the result.
The measurement model behind every number
The easiest reporting error is to treat a dashboard cell as a direct count of reality. A better model has four layers: observed search events, the platform’s counting rules, the requested slice, and the rows actually returned. Search Console’s documentation describes all four, but many reports preserve only the last layer.
Start with the event definition. A click is an interaction from a Google Search result that sends a user to the property. An impression depends on whether a result or result element was shown under Google’s display rules. Position is the topmost position occupied by the property or page for an impression, later averaged across impressions.4 These are Search measurements. They are not crawl counts, index counts, users, sessions, conversions, or a daily rank-check sample.
Next comes attribution and aggregation. Performance data is generally credited to Google’s canonical URL. The chart is aggregated by property, while a table grouped by Page or Search appearance is aggregated by page. Then filters define the requested population: search type, date, country, device, query, page, and appearance. Privacy filtering and internal row limits affect which query combinations can be itemized. Finally, a selected interface returns a finite set of rows, possibly with preliminary recent data.
| Layer | Question to record | Common false conclusion |
|---|---|---|
| Metric definition | What event does click, impression, CTR, or position represent? | “Clicks equal people” or “position equals one fixed rank.” |
| Aggregation | Is the data counted by property or by page? | “The chart must equal the page table.” |
| Population | Which property, search type, dates, countries, devices, and appearances are included? | “This dashboard represents all organic search.” |
| Visibility | Which rows are withheld, truncated, filtered, or outside the chosen export? | “Queries not shown generated zero clicks.” |
| Freshness | Is the newest period preliminary or final, and when was it extracted? | “Today is down 18%” while the day is incomplete. |
This model separates fact from interpretation. “The API returned 5,000 rows” is an observed fact. “Those rows cover every query” is an inference that the API contract does not support. “We will use the rows to prioritize known high-impression topics, but not to estimate the entire long tail” is an editorial decision that respects the boundary.
Missing rows are not missing clicks: why totals and visible query rows disagree
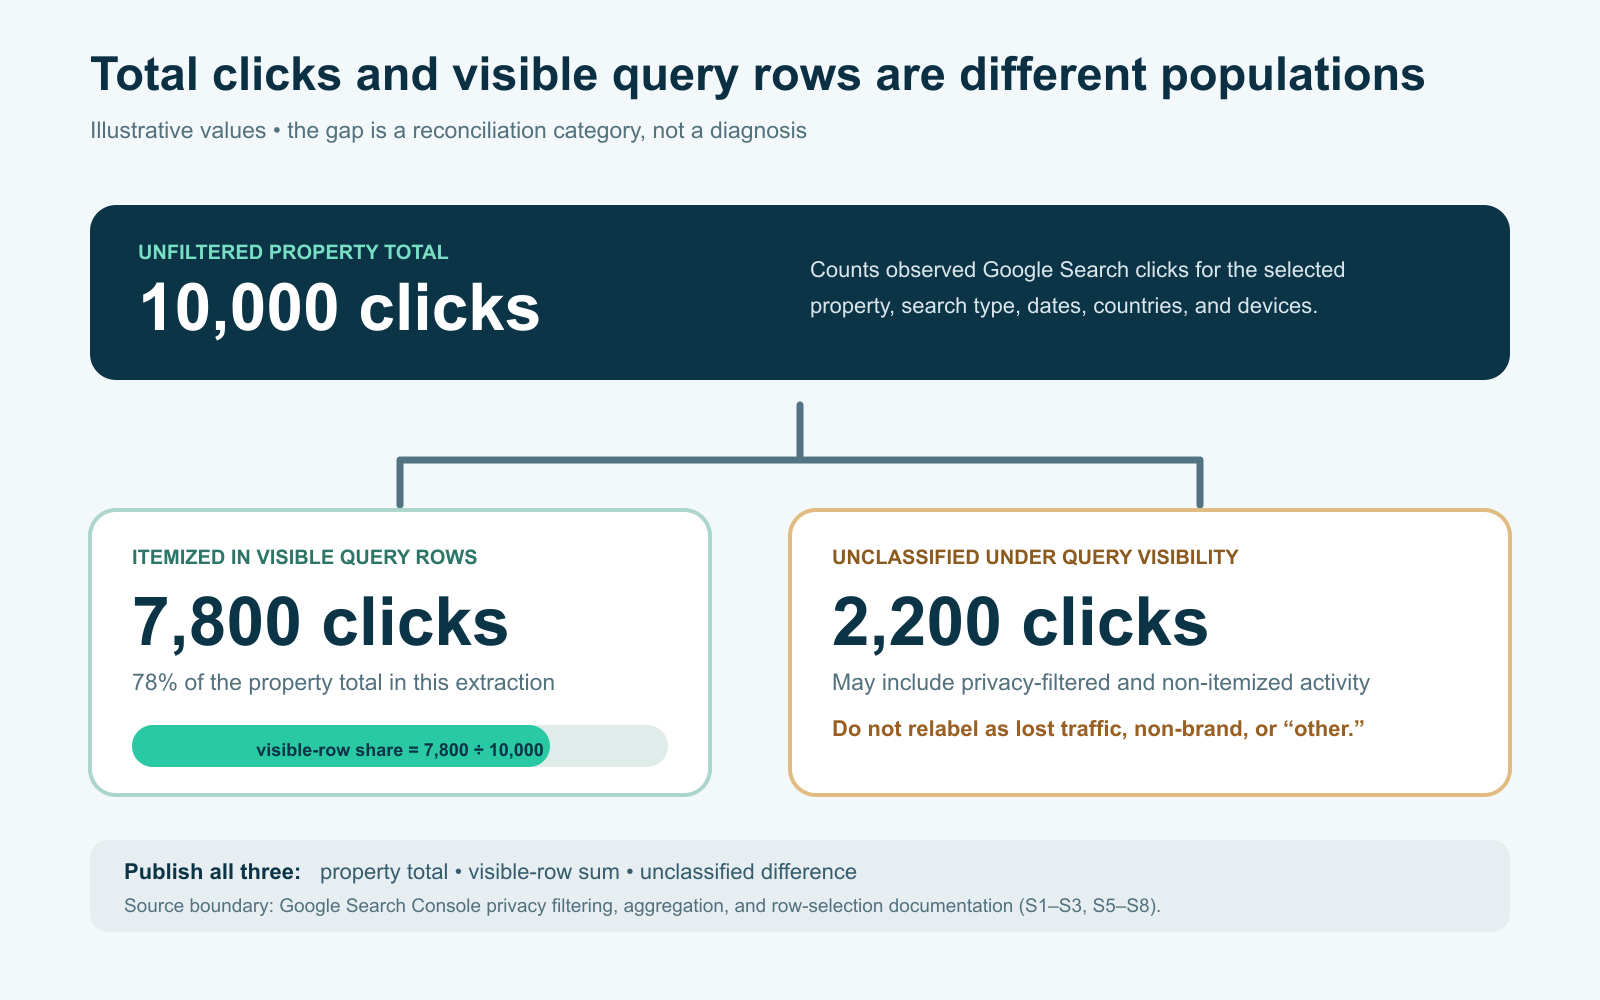
Search Console withholds some query strings to protect user privacy. Google calls them anonymized queries. They can be included in unfiltered chart totals even though no query row appears in the table or Search Analytics API. When a query filter is applied, anonymized queries are omitted from the filtered result because the system cannot expose whether a hidden string matched the filter.1, 2
That has a consequence that feels arithmetically wrong but is contractually correct. “Queries containing our brand” plus “queries not containing our brand” can sum to less than the unfiltered total. The remainder is not automatically non-brand, brand, bot traffic, tracking loss, or traffic that vanished. It is an unclassified remainder under the available query visibility.
Use three numbers, not one fabricated answer
A query report should keep the property total, the sum of visible query rows, and the difference as separate fields. Add a visible-query coverage ratio for operational context: visible query clicks ÷ unfiltered property clicks. In the illustration, that ratio is 78%. Call it “share of total clicks itemized in this extraction,” not “query data accuracy” and not “percentage of real keywords.” The denominator and extraction method must travel with the ratio.
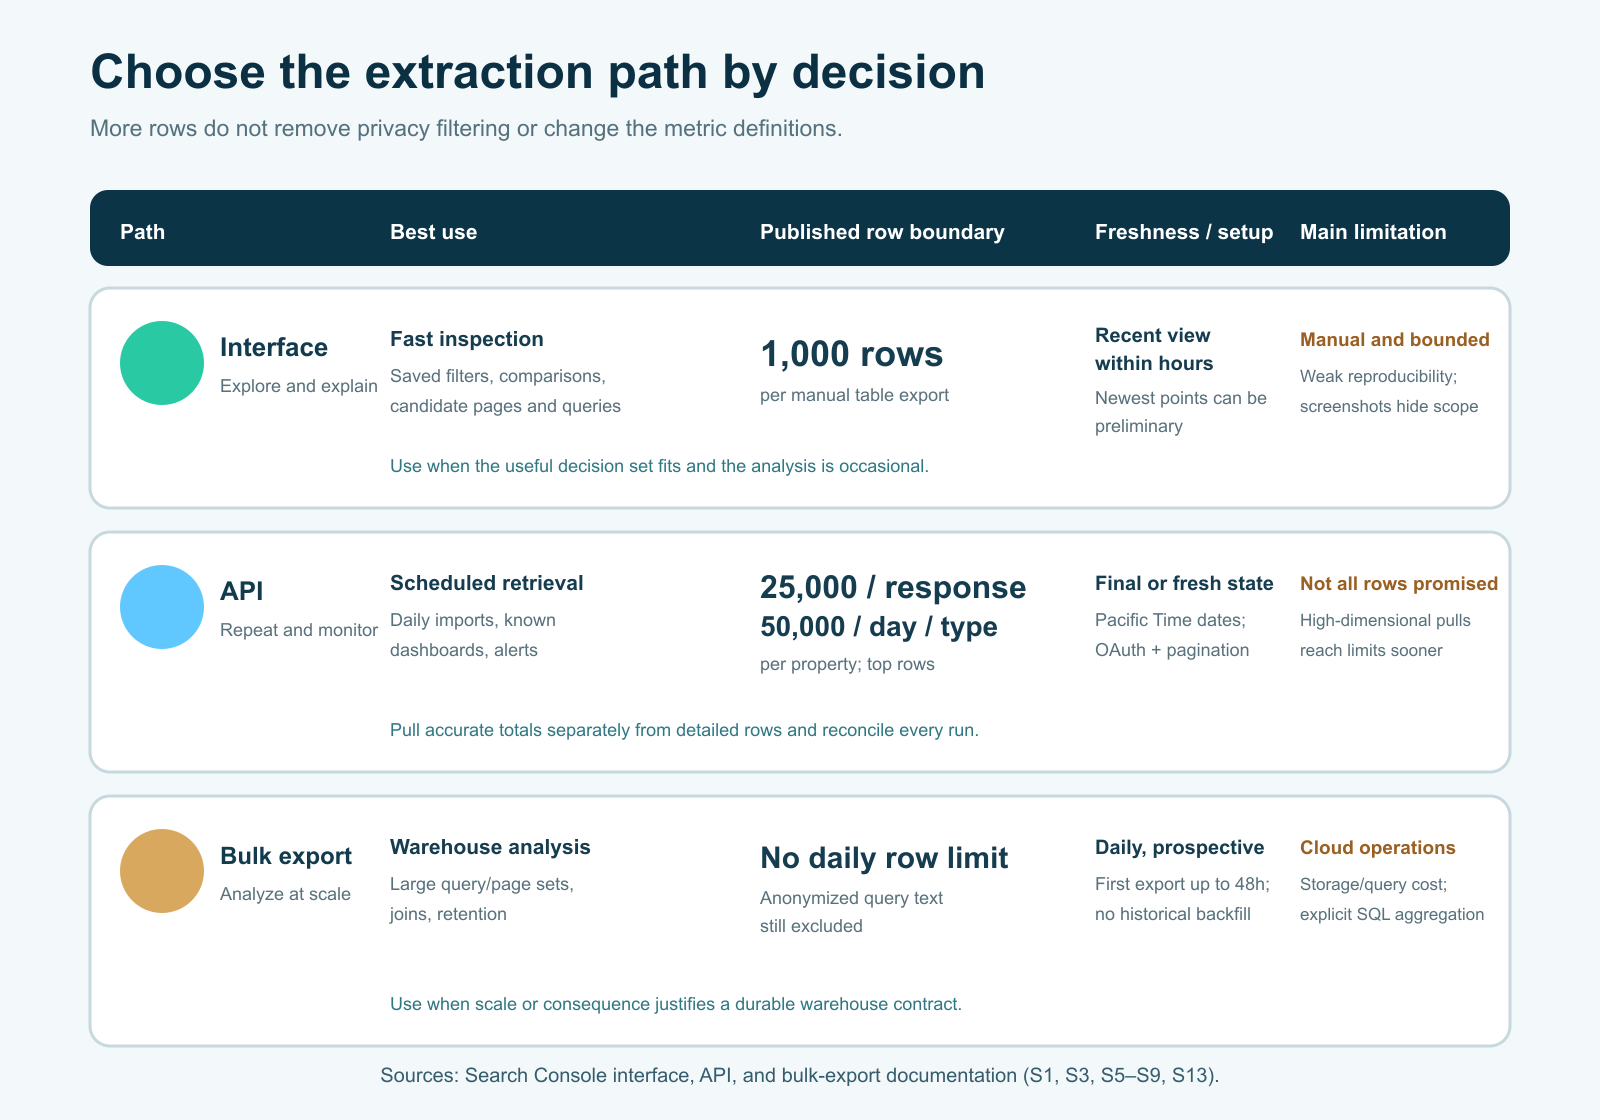
Row limits create another boundary. Google’s current documentation says the interface export is capped at 1,000 rows, while the Search Analytics API can expose up to 50,000 rows per day per property per search type, returned in pages of at most 25,000. The API explicitly does not guarantee every row; results are sorted by clicks and expose top rows within internal limits.1, 5, 6 Bulk export is not affected by that daily row limit, but it still excludes anonymized query text.7, 8
Do not estimate withheld query strings by dividing the gap by a guessed average click count. The hidden distribution is unknown. A 2,200-click gap could involve many one-click queries, fewer repeated queries, other row-selection effects, or a combination. The defensible statement is about coverage of itemized clicks, not the number or identity of hidden queries.
Property and page aggregation answer different questions
Suppose one results page shows three URLs from the same property. Under property aggregation, the property can receive one impression and its topmost position is used. Under page aggregation, each distinct URL can receive an impression and has its own topmost position. If the user clicks more than one of those URLs after returning to results, property and page click counts can also differ. Google’s current help documentation shows this explicitly and warns that chart and page-grouped table totals can diverge.3
Neither aggregation is the “real” one in isolation. They answer different questions. Property aggregation is appropriate for “How often did this property earn a visible presence?” Page aggregation is appropriate for “Which URL was visible and how did that URL perform?” A dashboard that joins a property-level chart total to page-level rows without preserving the grain is building a non-additive table.
The rule is simple: compare like with like. Keep a grain field in the data contract. Do not promise that sums across page rows will reproduce property totals. Do not use a page-aggregated denominator with a property-aggregated numerator. If a report switches grain between cards, label the cards individually rather than hiding the change in a tooltip.
Canonical assignment changes the visible URL
Most Search Console performance data is assigned to Google’s canonical URL, not necessarily the duplicate URL a user visited. Analytics, server logs, or campaign systems may retain the visited URL. A URL join can therefore fail even when both systems recorded the same journey. Normalize syntax, but do not “fix” the join by silently replacing every URL with your declared canonical. Google’s selected canonical can differ from the declaration, and that disagreement is diagnostic evidence.
Preserve at least three fields where possible: the source-reported URL, the normalized URL used for technical matching, and the canonical mapping used for analysis. Record the mapping date. Canonical selection can change, so a timeless lookup can rewrite history and create a false trend.
Preliminary, finalized, and frozen reporting windows
“Search Console is delayed” is now too blunt. The 24-hour view can expose recent hourly data after only a few hours, and the current Performance report marks the newest observations as preliminary when collection is still in progress. Preliminary points can change during the next few hours. Complete days remain the default view.3, 13
Honest reporting therefore needs two lanes. The operational lane uses preliminary data to ask whether an incident may be developing. It carries a visible “preliminary” state and can be revised. The decision lane uses complete, frozen dates to compare periods, evaluate changes, issue client reports, or trigger commercial decisions. It records the extraction time and never mixes a partial current day with a complete comparison day.
A fixed lag such as three days can be a conservative engineering choice, but it is not a universal statement that Search Console always takes three days. The better system observes which dates are complete for its workflow, records the last available date, and freezes a reproducible cutoff. When reports run in different timezones, remember that Search Console API dates use Pacific Time. Google Analytics can use a property-selected timezone, so even apparently identical calendar ranges can cover different hours.6, 10
Choose the UI, API, or bulk export deliberately
The extraction path should be part of the metric definition. Copying a chart from the interface, paging through the Search Analytics API, and querying BigQuery bulk export are not interchangeable routes to an identical table. They differ in scale, history, query flexibility, setup, cost, and row visibility.
Use the interface for exploration
The interface is fast for inspecting a trend, changing one filter, comparing periods, and identifying a candidate page or query. It is weak as a durable data pipeline. Exported tables are bounded, manual steps are hard to reproduce, and screenshots often omit filters and aggregation. If a decision can affect budget, staffing, or a release, preserve the exported data and a written configuration—not only the picture.
Use the Search Analytics API for repeatable bounded retrieval
The API is a good fit for daily imports, known dashboards, monitored page/query sets, and medium-scale analysis. Request one day at a time when completeness matters, paginate in 25,000-row batches, and stop only after an empty response. Record the requested dimensions, filters, search type, aggregation type, data state, and row count. A successful HTTP response proves that the request succeeded; it does not prove that every possible dimension combination was returned.
The dimension list is not free detail. Google’s API guide warns that adding Page and Query dimensions can lose some data relative to accurate aggregate counts. High-dimensional requests—query, page, country, device, appearance, and date—create many combinations and reach row boundaries sooner. Pull additive totals separately from detailed rows and reconcile them instead of expecting one query to serve both purposes.5
Use bulk export for ongoing high-volume analysis
Bulk export sends daily Search Console performance data to BigQuery and is designed for large sites or analysis that needs many query/page combinations. It provides site-impression and URL-impression tables and is not constrained by the Search Analytics API’s daily row limit. It begins prospectively after setup; the first export can take up to 48 hours and does not backfill earlier history. BigQuery storage and query costs remain the owner’s responsibility.7, 8
Query the export defensibly. Google’s sample guidance says rows are not guaranteed to be consolidated by the keys you expect, so aggregate measures explicitly. Calculate CTR as SUM(clicks) / SUM(impressions). Calculate average position from summed position and impression components according to the schema; do not average row-level CTR or average-position values. Keep site-impression and URL-impression tables separate unless the intended grain is explicit.9
The average-position failure
Average position is an impression-weighted average of the topmost position occupied by the property or page for the included impressions. It can describe different result elements and layouts, and Google itself warns that a position number can be misleading without context.4 It is useful as a trend within a stable segment. It is dangerous as a single “ranking” KPI across a changing mix.
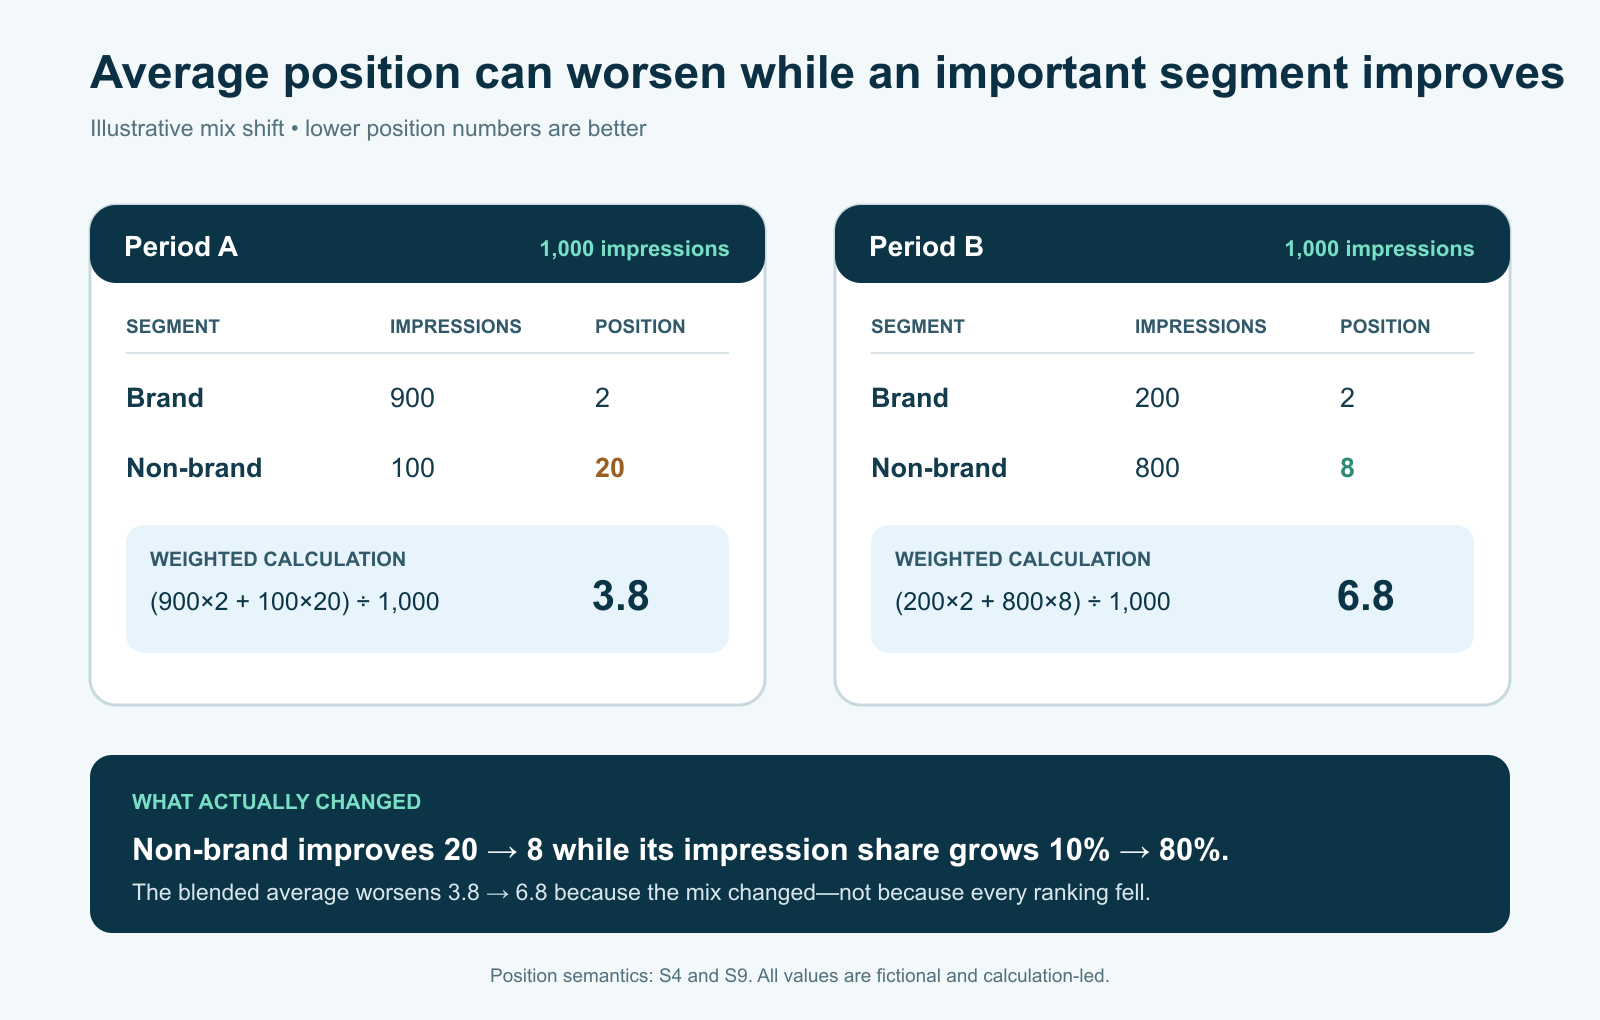
In period A, brand queries generate 900 impressions at average position 2 and non-brand queries generate 100 at position 20. The correct blended average is (900×2 + 100×20) ÷ 1,000 = 3.8. In period B, brand volume falls to 200 impressions at position 2 while non-brand grows to 800 impressions at position 8. The blended average becomes (200×2 + 800×8) ÷ 1,000 = 6.8.
A dashboard headline would say “position worsened by 3.” The segment evidence says something more useful: non-brand position improved from 20 to 8 and its visibility expanded dramatically, while brand demand or brand impression share fell. The blended movement is mathematically correct and strategically misleading.
Five rules for position reporting
- Never average averages. Recompute from the position numerator and impression denominator at one consistent grain.
- Pair position with impressions. A position change on ten impressions is not the same decision as the same change on one million.
- Segment the mix. At minimum inspect page, query class, device, country, and search appearance when they can change the meaning.
- Report distributions or thresholds where possible. Counts of impressions or queries in decision bands can be easier to interpret than one blended mean.
- Use clicks and impressions as primary outcome trends. Treat position as diagnostic context, not a revenue proxy or a promise about what a manual search will show.
Manual rank checks do not validate the average directly. Search results vary by time, location, device, history, and layout. Search Console records impressions that actually occurred under its rules; a one-time search is a new observation under another context.
Why Search Console and Analytics do not reconcile one to one
The most comparable pair is Search Console clicks and Google Analytics organic sessions, but they are still different metrics. A click happens in Google Search. A session begins after a site or app is measured, subject to tag execution and session rules. Google’s reconciliation guide explicitly says the totals will not match exactly and recommends comparing the overall pattern before investigating a large divergence.10
| Difference | Search Console | Analytics consequence |
|---|---|---|
| Measurement boundary | Interaction in Google Search | Site activity must load and be measured |
| Unit | Clicks | Sessions and users follow separate rules |
| Timezone | Pacific Time for API dates | Property-configured timezone |
| URL attribution | Generally Google-selected canonical | Measured landing URL carrying the tag |
| Consent and blocking | Uniform Search-side processing | Consent, blockers, tag failures, and redirects can prevent measurement |
| Coverage | Can include non-HTML Search destinations such as PDFs | Only destinations instrumented for the Analytics implementation |
Reconciliation is therefore a diagnostic, not an equality test. Align dates, timezone, source/medium, country, device, and landing-page scope. Account for redirects and canonical assignment. Check consent and tag coverage. Then compare trend shape and the stable ratio between systems. Escalate a sudden structural break; do not spend weeks eliminating a normal definitional gap.
Build an honest reporting pipeline
An honest pipeline makes the data contract executable. It stores configuration and diagnostics next to the metric rather than relying on an analyst’s memory. The following sequence works for a spreadsheet, a warehouse, or an application service.
1. Write the decision before the query
“Show SEO performance” is not a decision. “Decide whether non-brand product discovery weakened after the category migration” is. The second statement determines the property, search type, page cohort, query classification, countries, devices, comparison dates, and guardrails. It also exposes what Search Console cannot decide alone: conversion impact and causal attribution.
2. Create a metric contract
For each published metric, record its name, unit, numerator, denominator, grain, inclusion filters, exclusions, aggregation, timezone, freshness rule, extraction path, and owner. Version the contract. If the definition changes, annotate the time series or start a new series rather than splicing incomparable numbers together.
3. Pull totals and detail separately
Request accurate aggregate totals without Page or Query dimensions. Pull detailed rows for diagnosis in a separate extraction. Store both. Compute the visible-row sum and reconciliation gap for every run. A growing gap can reflect mix or row-boundary effects; it is a data-quality signal to investigate, not automatically an SEO loss.
4. Preserve raw dimensions and additive components
Keep date, search type, page, query where visible, country, device, and search appearance at the chosen grain. Preserve clicks, impressions, and the position numerator available through the source schema. Derived CTR and average position should be reproducible. Never store only rounded dashboard percentages.
5. Validate before explanation
Check row counts, duplicate keys, missing dates, export status, preliminary dates, filters, property identity, and source anomalies. Search Console maintains a data-anomalies record because logging and aggregation incidents can affect charts. A platform incident belongs in the annotation layer before anyone writes a story about an algorithm update.
6. Segment, then narrate
Decompose changes by page cohort, query class, country, device, and appearance. Compare like periods and check seasonality. Google’s traffic-drop workflow recommends using the available 16-month window for context, comparing similar periods, and inspecting the dimensions where the change occurred.11 Move from “traffic fell” to a falsifiable statement such as “mobile web clicks to migrated category pages in the US fell after impressions fell; CTR remained within its previous range.”
7. Publish the disclosure beside the conclusion
W3C Data on the Web Best Practices recommends publishing provenance and quality information and explaining unavailable data. The UK Statistics Authority’s current Code of Practice likewise requires prominent explanation of quality, strengths, limitations, and uncertainty.12, 14 SEO reporting is not official statistics, but the discipline transfers: a reader should know what population, transformation, and uncertainty produced the claim.
Worked example: reconcile before diagnosing
A marketplace reports that web clicks fell from 120,000 to 102,000 after a template release, a 15% decline. The first instinct is rollback. The analyst pauses and applies the reporting contract.
- Freeze comparable windows. Both periods contain 28 complete Pacific Time days. No preliminary day is included.
- Confirm source scope. Both use the same domain property, Web search type, all countries, and all devices. The prior dashboard had accidentally included Image search in one saved view; that view is rejected.
- Check data health. No missing export dates appear. The Search Console anomaly log shows no relevant incident. API row counts and the visible-query coverage ratio are stable.
- Decompose the change. Branded homepage clicks are down 16,500; migrated category pages are down 1,900; product pages are up 400. Most of the total decline is brand demand, not the released template.
- Inspect the released cohort. Category impressions fell 4%, CTR fell 1%, and average position moved from 7.4 to 8.1 on mobile in two countries. That is enough to inspect the release, but not enough to attribute the full sitewide loss to it.
- Bring external evidence. Analytics organic sessions show a similar category pattern after timezone alignment. Technical crawl and page snapshots reveal that eight category pages lost internal links. Brand-search interest also fell during the period.
The revised conclusion is narrower and more actionable: “Most of the 15% sitewide click decline is associated with lower branded demand. A smaller mobile category decline overlaps the release and a confirmed internal-link regression; restore those links and monitor the cohort.” The report prevents both a false all-clear and a false rollback.
A 30-day measurement plan
What to do this week
- Inventory every Search Console dashboard, scheduled export, API job, and spreadsheet.
- For each metric, record property, search type, dates, timezone, dimensions, filters, aggregation, data state, and extraction path.
- Add separate property totals, visible-row sums, and reconciliation gaps.
- Replace averaged CTR and position with calculations from additive components.
- Label preliminary data and exclude it from fixed-period decisions.
- Document canonical URL treatment and Search Console-to-Analytics join rules.
- Add a visible limitations block to client and executive reports.
What to observe for 30 days
- Daily export success and the last complete date.
- Row counts by source, search type, and requested dimension set.
- Visible-query click and impression coverage relative to unfiltered totals.
- The time required for preliminary dates to stabilize under your reporting cadence.
- Search Console clicks versus aligned Analytics organic sessions as a ratio and trend, not an equality target.
- Average position alongside query/page mix and impression volume.
- Known platform anomalies, site releases, migrations, outages, and major demand events.
When to change course
Move from interface exports to the API when manual steps prevent reproducibility or 1,000 rows routinely truncate the decision set. Move from the API to bulk export when the 50,000-daily-row boundary, high-dimensional analysis, long-term retention, or cross-dataset joins materially constrain decisions. Do not adopt BigQuery only because it sounds more complete: small sites may add cost and operational risk without gaining useful rows.
Escalate a data-quality incident when a normally stable reconciliation ratio shifts materially without a matching product or traffic explanation, a completed date changes after your freeze rule, export logs show a gap, or Search Console and Analytics trend shapes diverge beyond their established range. Escalate an SEO incident only after those source checks pass and the change localizes to a meaningful page/query/device/country cohort.
The strongest counterposition
A reasonable counterposition is that most teams do not need this machinery. Search Console says its remaining rows are representative for the few very large properties affected by row limits, and directional trend reporting is often sufficient. Adding reconciliation tables, warehouses, and disclosure text can slow decisions and bury stakeholders in caveats.
That criticism is correct when the decision is low stakes and the trend is large, stable, and visible across compatible segments. A local business does not need BigQuery to notice that clicks doubled after a seasonal reopening. An editorial team does not need a data-governance programme to pick three high-impression pages for title review.
The conclusion survives because the required discipline can be proportional. The minimum is not a warehouse. It is a saved scope, a complete date range, a stated grain, and one sentence explaining that query rows are not exhaustive. More infrastructure is justified only when scale or consequence demands it. What does not scale down is the right to relabel an unknown remainder as lost traffic or a blended average as a causal result.
Small-site, large-platform, and product boundaries
For a small site
Use the interface or a simple API pull. Keep one reporting sheet with unfiltered totals, visible query rows, page totals, extraction date, and filters. Compare complete 28-day windows, annotate releases, and investigate only material changes. If nearly all useful rows fit in the interface and decisions are infrequent, bulk export is unnecessary.
For a large platform
Prefer prospective bulk export, partitioned tables, export-log monitoring, explicit site-versus-URL grains, metric contracts in version control, and tests for duplicate keys and missing partitions. Preserve raw additive fields, build canonical history, and define cohorts outside the presentation layer. Give every executive metric a drill-down that retains the same population and calculation.
Where 2-UA fits—and where it does not
2-UA can import read-only Search Console performance data for connected properties, retain page and query evidence, compare complete reporting windows, monitor selected queries, and connect traffic context to tracked URLs and technical changes. Those workflows help a team notice and investigate a change without treating position as a guaranteed rank or GSC as causal proof.
2-UA is not a replacement for Search Console bulk export, BigQuery, Google Analytics, server logs, or a company’s revenue warehouse. Its Search Console views inherit the source’s privacy filtering, aggregation rules, and API row boundaries. Query absence is not proof of zero demand. Conversion and revenue conclusions require Analytics or transaction data, and causal claims require an appropriate experiment or design. This is the product boundary, not a footnote.
What the evidence does not show
- No source publishes a universal percentage of query traffic that will be anonymized. The share depends on the property, period, filters, and query distribution. Do not borrow another site’s coverage ratio.
- Visible rows are not proven to be a statistically representative sample for every analysis. Google describes top-row selection and says large-site remnants can be representative, but it does not publish a sampling design, confidence interval, or guarantee for a specific property.
- Bulk export does not reveal anonymized query strings. It removes the daily data-row limit, not the privacy rule.
- A preliminary point is not known to stabilize after one universal delay. Current documentation says it can change during the next few hours; each reporting system still needs a conservative freeze rule.
- Average position does not identify one stable rank. It combines impressions across contexts and result elements using the topmost property/page position.
- A Search Console click is not a person, session, lead, or purchase. Business value requires downstream evidence with a declared join and attribution model.
- A coincident traffic change does not prove a release, ranking system, competitor, or season caused it. Segmentation narrows hypotheses; it does not create causality.
- The independent reporting standards do not validate Google’s data. They support the editorial practice of publishing provenance, limitations, missing-data explanations, and uncertainty.
Implementation checklist
| Control | Pass condition |
|---|---|
| Scope | Property, search type, dates, timezone, countries, devices, pages, queries, and appearances are visible. |
| Freshness | Preliminary dates are labelled and excluded from frozen decisions. |
| Grain | Property and page aggregation are named; incompatible totals are not added. |
| Extraction | UI, API, or bulk export is recorded with row limits, pagination, and extraction time. |
| Privacy | Anonymized query activity is disclosed; hidden queries are not inferred. |
| Reconciliation | Unfiltered totals, visible-row sums, and the difference remain separate. |
| Calculations | CTR and position are recomputed from additive components, never averaged from averages. |
| Mix | Blended changes are decomposed by the segments that can change the decision. |
| Cross-system comparison | Clicks and sessions are aligned but not forced to equality; large breaks are investigated. |
| Provenance | Definition version, source, filters, owner, known incidents, and limitations travel with the result. |
| Decision language | The conclusion distinguishes observed fact, inference, and recommended action. |
The honest report is not the one with the most caveats. It is the one whose caveats change the calculation, the comparison, or the decision. Search Console can tell you that observed Search visibility and clicks changed for a defined population. It can help locate the page, query class, device, country, or appearance where the change occurred. It cannot turn withheld rows into known keywords, average position into one rank, or correlation into cause. Preserve those boundaries and the data becomes more useful—not less.
References
- Daniel Waisberg, Google Search Central, “A deep dive into Search Console performance data filtering and limits”, October 19, 2022; read September 29, 2026.
- Google Search Console Help, “Performance report (Search results): Dimensions and data groupings”, current documentation read September 29, 2026.
- Google Search Console Help, “Performance report (Search results): About the data”, current documentation read September 29, 2026.
- Google Search Console Help, “What are impressions, position, and clicks?”, current documentation read September 29, 2026.
- Google Search Console API, “Getting your performance data”, current documentation read September 29, 2026.
- Google Search Console API, “Search Analytics: query”, current reference read September 29, 2026.
- Google Search Console Help, “About bulk data export of Search Console data to BigQuery”, current documentation read September 29, 2026.
- Daniel Waisberg, Gaal Yahas, and Haim Daniel, Google Search Central, “Bulk data export: a new and powerful way to access your Search Console data”, February 21, 2023.
- Google Search Console Help, “Query guidelines and sample queries”, current documentation read September 29, 2026.
- Google Search Central, “Using Search Console and Google Analytics data for SEO”, current documentation read September 29, 2026.
- Google Search Central, “Debug Google Search traffic drops”, current documentation read September 29, 2026.
- W3C Recommendation, “Data on the Web Best Practices”, January 31, 2017, especially best practices for provenance, data quality, coverage, and unavailable data.
- Moshe Samet, Google Search Central, “An improved way to view your recent performance data in Search Console”, December 12, 2024.
- UK Statistics Authority, “Code of Practice for Statistics,” edition 3.0, 2025, principles on rigorous methods, quality, limitations, uncertainty, clarity, and accessibility.